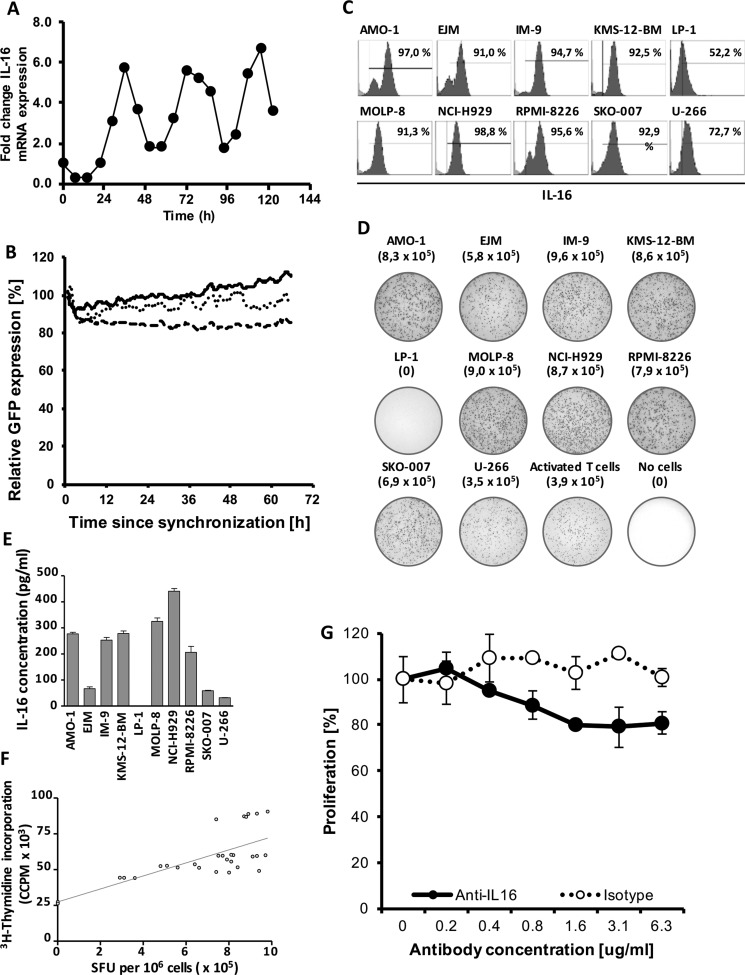
Figure 1. Stable downregulation of oscillating IL-16 mRNA expression.
(A) Representative quantitative RT-PCR of IL-16 expression in RPMI-8226 cells after normalization to GAPDH. Cells were synchronized for 24 h by serum starvation and then grown under standard conditions. (B) Cumulative fluorescence intensity in RPMI-8226 cells of three destabilized GFP mutants expressed under control of the human IL-16 promoter as determined by spinning-disk live cell fluorescence microscopy. The solid line represents MM cells expressing pTurboGFP-dest1, the dotted line represents cells expressing pTurboGFP-dest1 including the mutation H423A, and the dashed line represents cells expressing pTurboGFP-dest1 including the mutations D433A and D434A. Lines represent a moving average of 4 time points. (C) Intracellular staining of IL-16 in MM cell lines as determined by flow cytometry. (D) IL-16 ELISpot demonstrating strong IL-16 secretion in 9 of 10 MM cell lines as well as activated primary human T cells. (E) IL-16 concentrations in culture supernatants harvested from 10 MM cell lines as determined by ELISA. (F) Correlation of Spot-Forming Units (SFU) as determined by IL-16 ELISPOT and MM cell proliferation as determined by 3H-Thymidine incorporation assay. (G) Proliferation of MM cell line RPMI-8226 after 12 h treatment with an IL-16 neutralizing antibody or an isotype control antibody as determined by 3H-thymidine incorporation assay.

