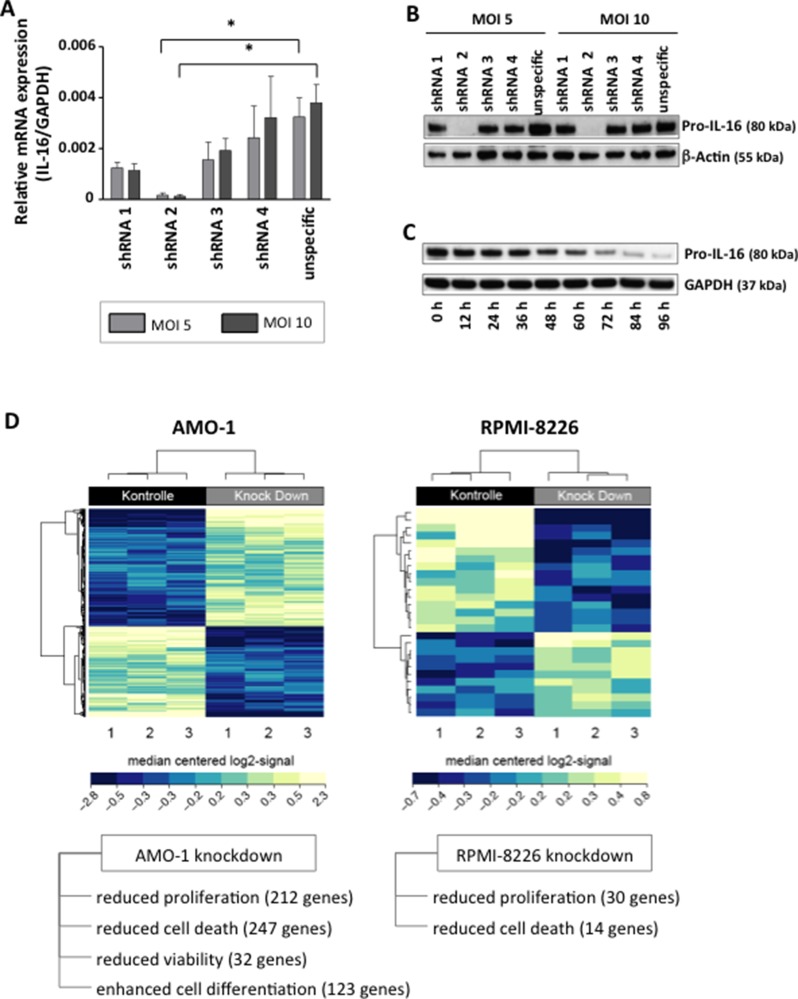
Figure 2. Downregulation of IL-16 in MM cell lines and genome-wide mRNA expression analysis.
(A) Relative expression of IL-16 mRNA as determined by quantitative RT-PCR in MM cell line RPMI-8226 after induction of IL-16-specific or control shRNA after transduction of cells with lentiviral supernatants at different multiplicities of infection (MOI). (B) Western blot of Pro-IL-16 and loading control β-Actin at 96 h after transduction with four IL-16-specific shRNA constructs or one unspecific control shRNA. (C) Time-course of the expression of Pro-IL-16 and loading control GAPDH over 96 h after transduction with IL-16-specific shRNA. (D) Heatmap of hierarchically clustered genes differentially regulated in MM cell lines expressing IL-16-specific shRNA or control shRNA.

