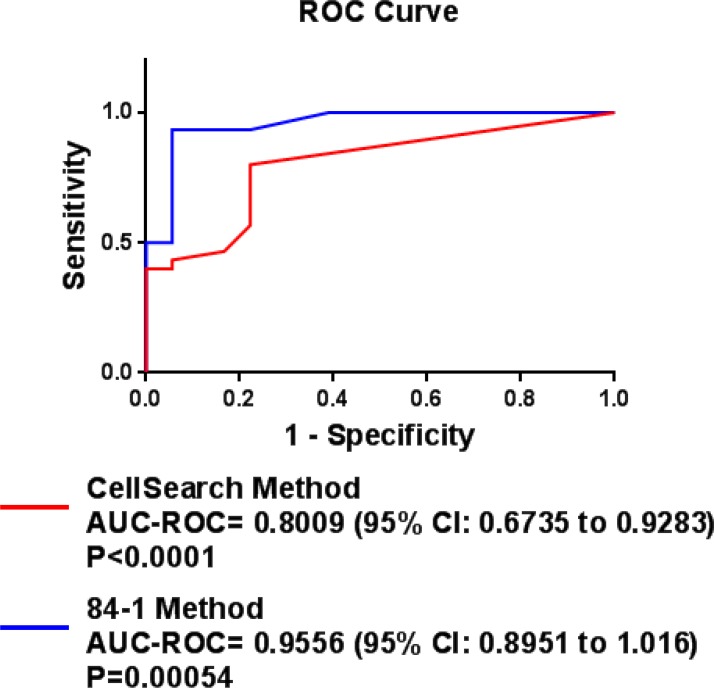
Figure 3. ROC curves for CTC counts using the CSV and CellSearch methods and serum PSA levels: ROC curves were determined to discriminate the patients with responding/stable disease from the patients with non-responding/progressive metastatic prostate cancer.
An AUC-ROC value of closer to 1 denotes a perfect method for discrimination.

