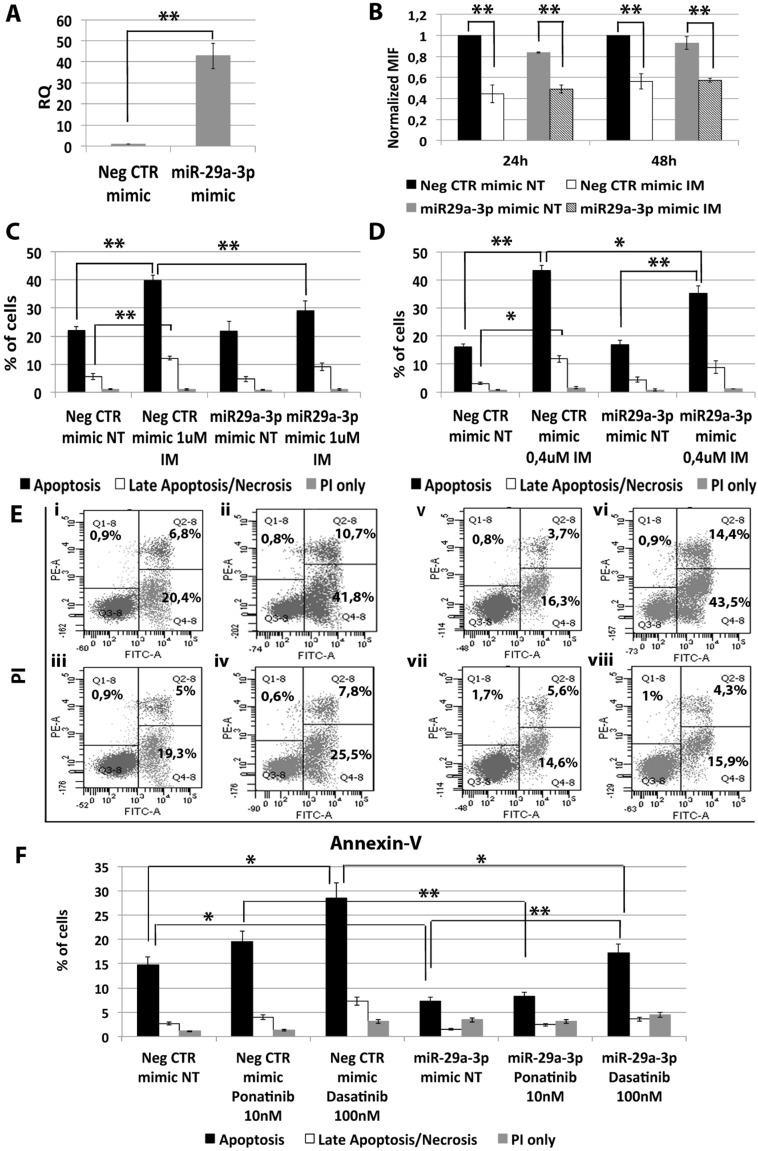
Figure 2. Effects of miR-29a-3p overexpression on K562 cells' response to TKIs.
(A) Expression levels of miR-29a-3p 24 hours after the last nucleofection as evaluated by qRT-PCR. Data are reported as RQ mean ± S.E.M of 3 independent experiments. (B) Normalized MIF of intracellular p-CrkL levels in K562 cells after miR-29a-3p overexpression. pCRKL MIF of the Neg CTR mimic untreated control was set to 1 to compare K562 before and after treatment with IM. The results are expressed as mean values ± SEM (n = 3). Results of Annexin V/PI staining on K562 cells after 24 h (C) and 48 h (D) of IM treatment (mean ± SEM; n = 3) *p < 0.05, **p < 0.01. Apoptotic cells (black bars in the histogram plot) are Annexin V bright and PI low, late apoptotic cells or necrotic cells (white bars in the histogram plot) are Annexin V and PI bright, grey bars represent cells bright for PI only. Representative dot plots for flow cytometry detection of Annexin V and PI staining at 24 h and 48 h after treatment are shown (E) i: Neg CTR mimic NT, ii: Neg CTR mimic IM 1 μM, iii: miR-29a-3p mimic NT, iv: miR-29a-3p mimic IM 1 μM, v: Neg CTR mimic NT, vi: Neg CTR mimic IM 0.4 μM, vii: miR-29a-3p mimic NT, viii: miR-29a-3p mimic IM 0.4 μM). (F) Results of Annexin V/PI staining on K562 cells after 24 h of 10 nM Ponatinib or 100 nM Dasatinib treatment (mean ± SEM; n = 3) *p < 0.05, **p < 0.01. Abbreviations: RQ, Relative Quantity; MIF indicates Mean Fluorescence Intensity; IM, Imatinib Mesylate; NT, Not Treated; 24 h, 24 hours; 48 h, 48 hours; PI, Propidium Iodide.

