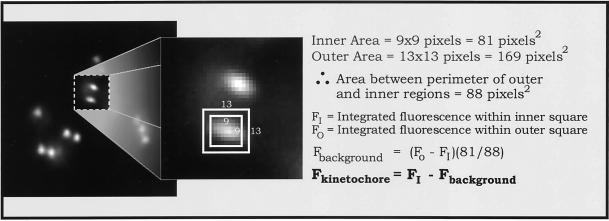
Figure 3.
Analysis used to determine the integrated intensity of a given immunofluorescently stained kinetochore as diagrammed in the figure and described in MATERIALS AND METHODS. The great majority of kinetochore fluorescence is contained within the central 9 × 9 pixel square, which corresponds to a 0.9- × 0.9-μm square region of the specimen.

