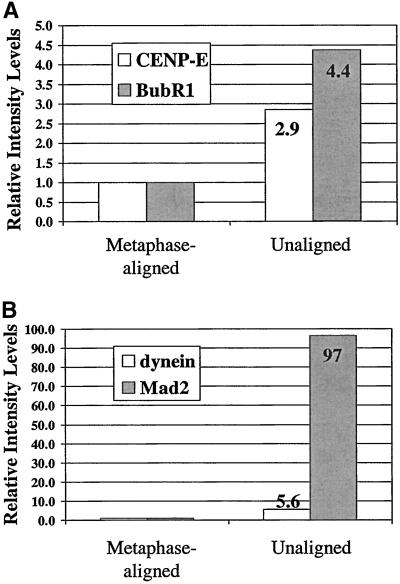
Figure 5.
Quantitative comparisons of the relative changes in fluorescence of unattached or leading kinetochores in prometaphase (Figure 4A) labeled with CENP-E, and BubR1 antibodies in (A) and cytoplasmic dynein and Mad2 antibodies in (B) relative to kinetochores on chromosomes at the metaphase plate. Average values taken from Table 1 are normalized to those values for metaphase control cells. Note that unattached or leading kinetochores exhibit integrated fluorescence intensity levels relative to kinetochores of metaphase-aligned chromosomes of 4.4 for BubR1 (A), 2.9 for CENP-E (A), 5.6 for cytoplasmic dynein (B), and 97 for Mad2 (B).

