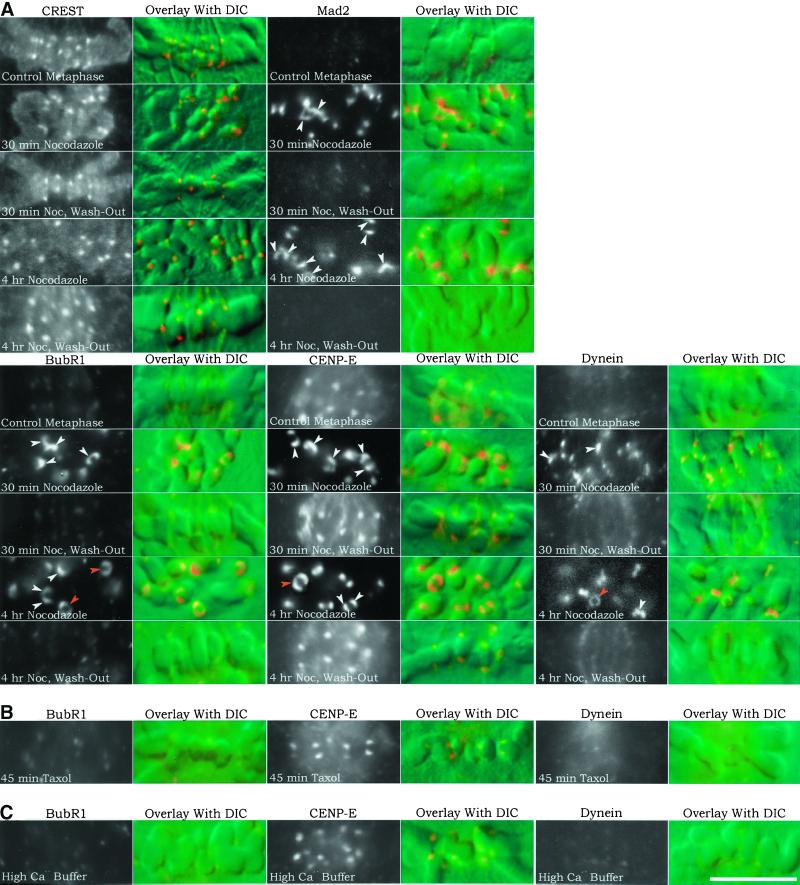
Figure 6.
Kinetochore immunofluorescence and corresponding chromosome DIC image overlays of PtK1 cells treated with nocodazole, taxol, or high Ca2+ buffer. Changes in kinetochore protein localization were compared between control metaphase cells and cells treated with 20 μM nocodazole for 30 min or 4 h to induce prolonged microtubule disassembly or the same treatments followed by nocodazole washout for 30 min to induce microtubule reassembly and kinetochore microtubule formation (A); 10 μM taxol for 45 min to induce loss of kinetochore tension without major changes in kinetochore microtubule number (B); and high Ca2+ buffer at 4°C after cell lysis to induce disassembly of kinetochore microtubules and test for microtubule steric hindrance of antibody labeling (C). For each protein tested, both immunofluorescence and DIC images were recorded. The left column contains black-and-white rhodamine-fluorescence images of immunofluorescence all printed at the same contrast to show relative differences in immunostaining brightness levels. The right column contains color overlays of rhodamine fluorescence on the corresponding DIC images of the chromosomes. Color images were artificially contrast-enhanced to show location of kinetochores on the chromosomes. Arrowheads in the Mad2, BubR1, CENP-E, and cytoplasmic dynein images of cells treated with nocodazole for 30 min or 4 h indicate kinetochore crescent (white arrowheads) or ring-shaped (orange arrowheads) morphologies. Under all conditions tested, kinetochores stained with CREST maintained the same punctuate or oblate morphology. Scale, 10 μm.

