
Figure 2. Dexamethasone causes membrane accumulation of TNF-α.
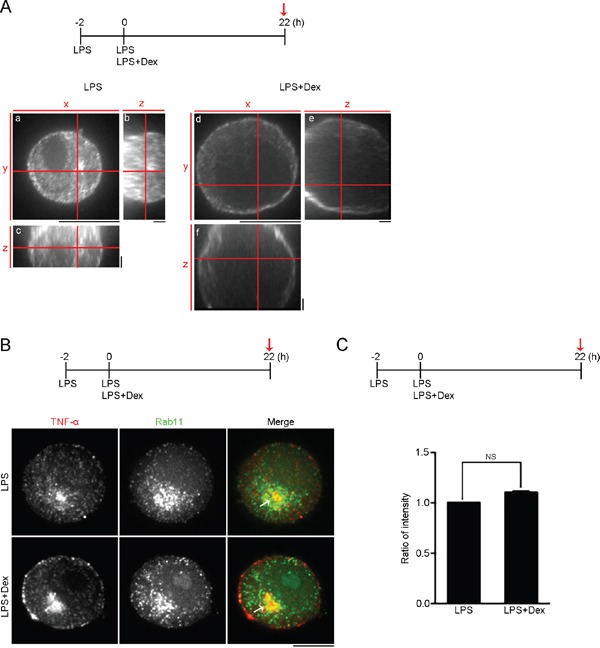
(A) High magnification orthogonal projections of TNF-α staining. Confocal images with orthogonal views demonstrate cellular distribution of TNF-α in RAW264.7 cells treated with 0.1 μg/ml LPS only or 0.1 μg/ml LPS + 1 μM Dex at the time point highlighted with red arrow. (a and d) High magnification XY-average projections of TNF-α. (b and e) High magnification YZ-average projections of TNF-α. (c and f) High magnification XZ-average projections of TNF-α. Scale bars: a and d: 10 μm; b, c, e and f: 2 μm. (B) Confocal images of TNF-α and Rab11 double staining of RAW264.7 cells after the indicated treatments at the time point highlighted with red arrow. Bar, 10 μm. (C) Ratio of average density of Rab11 within TNF-α-localized regions of the cells treated after the indicated treatments at the time point highlighted with red arrow. (n = 4 cells; data are mean ± s.e.m.). NS, no significance.