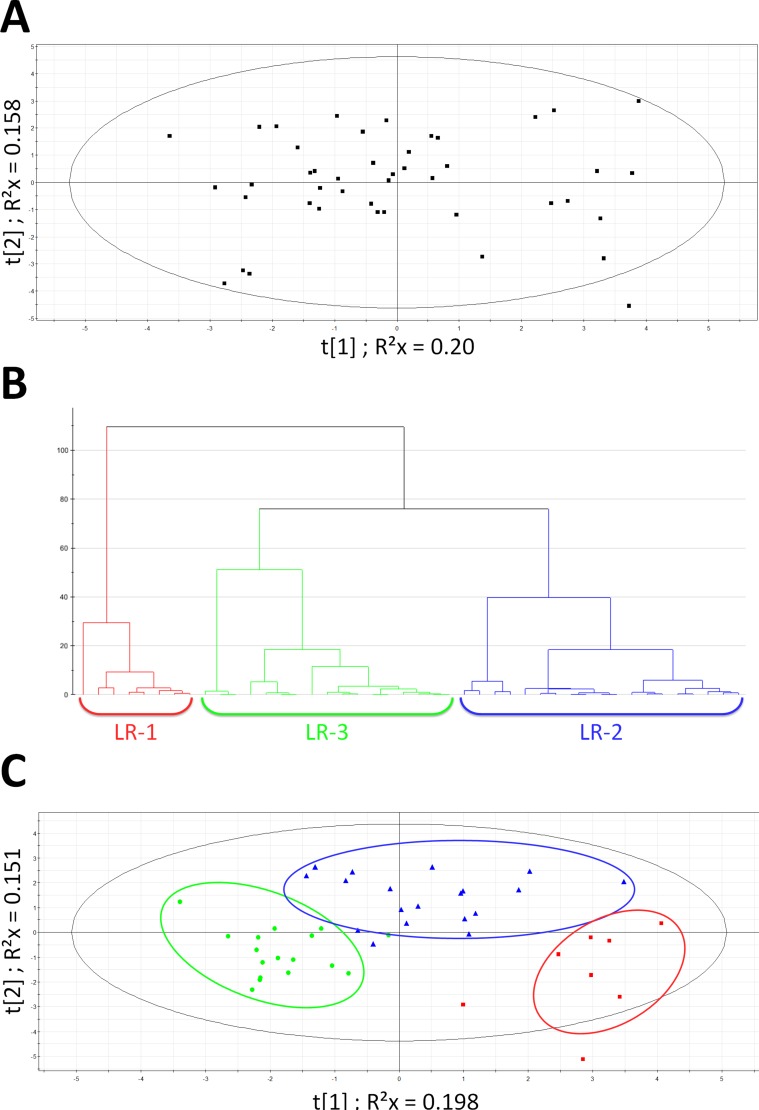
Figure 1. Multivariate statistical analysis on EBC population.
(A) Scores scatter plot obtained after PCA on EBC population. Model parameters: R2cum = 0.737; Hotelling T2 = 0.95. Eigth proposed principal components (B) Hierarchical clustering on EBC population: 3 patient's subgroups emerged: LR-1 (red), LR-2 (blue) and LR-3 (green). The distance is calculated with Ward and sorted by size. (C) PLS-DA on EBC population - clusters defined by HC : LR-1(red square); LR-2 (blue triangle); LR-3 (green dot). Model parameters: R2Xcum = 0.35; R2 Ycum = 0.649; Q2cum = 0.519 Hotelling T2 = 0.95; Two proposed principal components.

