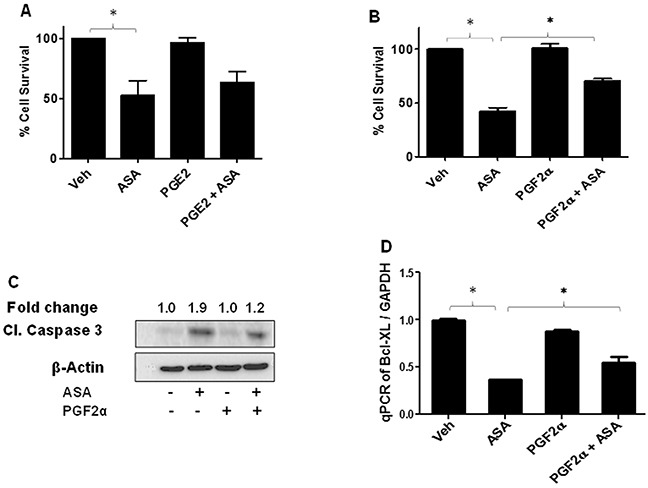
Figure 4. Effect of PGE2 and PGF2α on ASA-induced effects on cell survival and apoptosis induction.

B16-MSCV cells were pretreated with PGE2 or PGF2α at 1.0 μg/ml dose and left for 24 hour followed by treatment with or without ASA (5 mM) and cultured for 72 hour. (A-B) % cell survival was measured by SRB assay, (C) cleaved caspase 3 by western blotting as described. The fold change in cleaved caspase 3 between ASA ± PGF2α treated cells is shown for quantification. (D) Total RNA was extracted from these treatments and cDNA samples were analyzed for Bcl-XL by qRT-PCR and normalized to GAPDH. Data are the mean ± SD and expressed as % cell survival, aspase 3/7 activity/mg protein or Bcl-XL/GAPDH in various groups from at least three separate experiments.
