
Figure 3. Analysis of global transcriptional changes modulated by ERβ agonists in OCa cells.
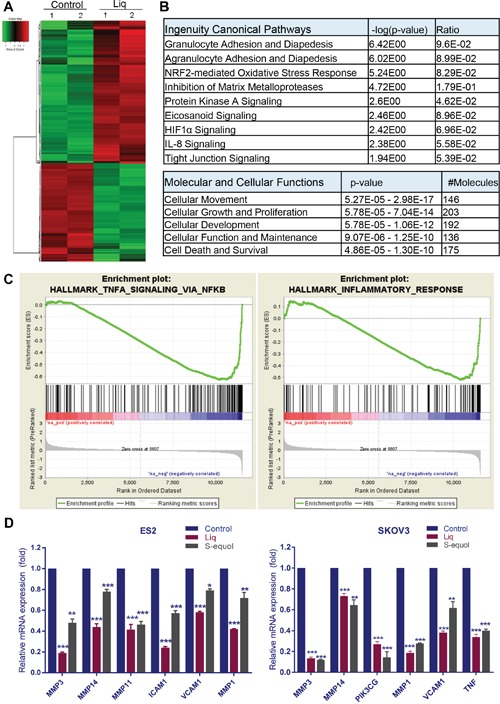
Total RNA was isolated from the ES2 cells that were treated with either vehicle or Liq (100 μM) for 24 h and subjected to RNA sequencing. (A) Heat map of differentially expressed genes between vehicle and Liq is shown. (B) Differentially expressed genes were subjected to pathway analysis using IPA software, and the selected top canonical pathways are shown. Analysis of molecular and cellular functions of differentially expressed genes are shown. (C) Gene set enrichment analysis (GSEA) testing correlation of Liq-regulated genes with signatures of NF-κB signaling gene set and inflammatory response gene set. (D) ES2 and SKOV3 cells were treated with either vehicle or Liq or S-equol for 24 h, and the selective genes representing each pathway were validated by using RT-qPCR. Data are represented as mean ± SE. * p<0.05; ** p<0.01; *** p<0.001.