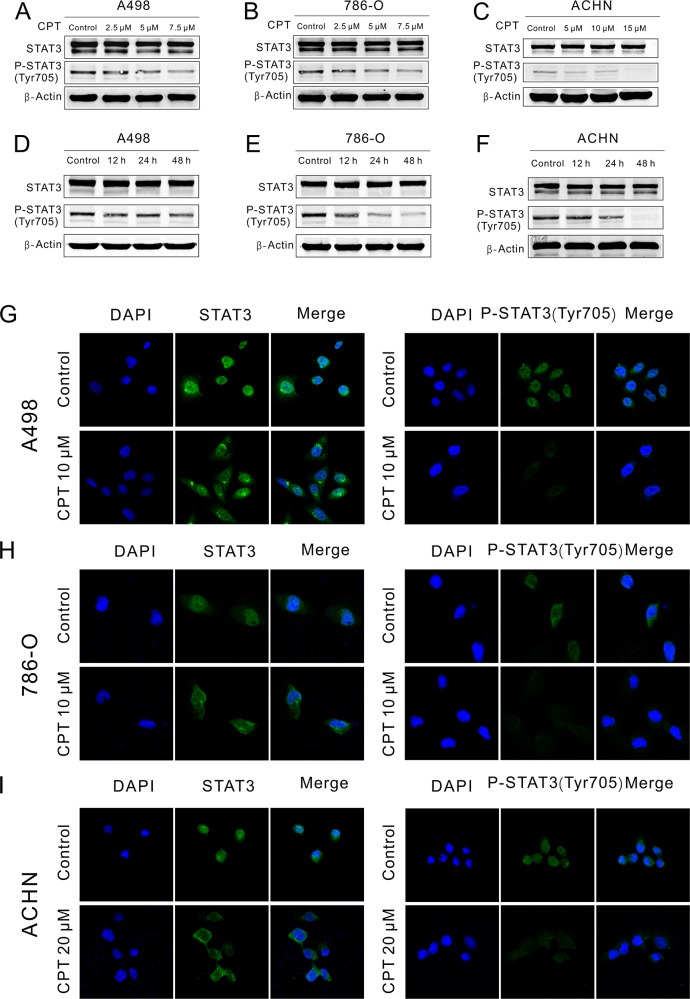
Figure 4. CPT blocked P-STAT3 expression and translocation.
(A) (B) (C) A498,786-O, and ACHN cells were plated in 6-well plates and treated with varying concentrations of CPT for 48 h. STAT3 and P-STAT3 (Tyr705) expression was detected by Western blotting. β-Actin was used as a loading control. (D) (E) (F) A498,786-O, and ACHN cells were plated in 6-well plates and treated with CPT for 12, 24 h, and 48 h. STAT3 and P-STAT3 (Tyr705) expression was detected by Western blotting. β-Actin was used as a loading control. (G) (H) (I) A498, 786-O and ACHN cells were treated with CPT for 2 h. STAT3 and P-STAT3(Tyr705) location was detected by immunofluorescence staining assay. Representative immunofluorescence analyses by a confocal microscopy are shown. The nuclei were stained with DAPI. Scale bar =10 μm. Three different independent experiments were performed.

