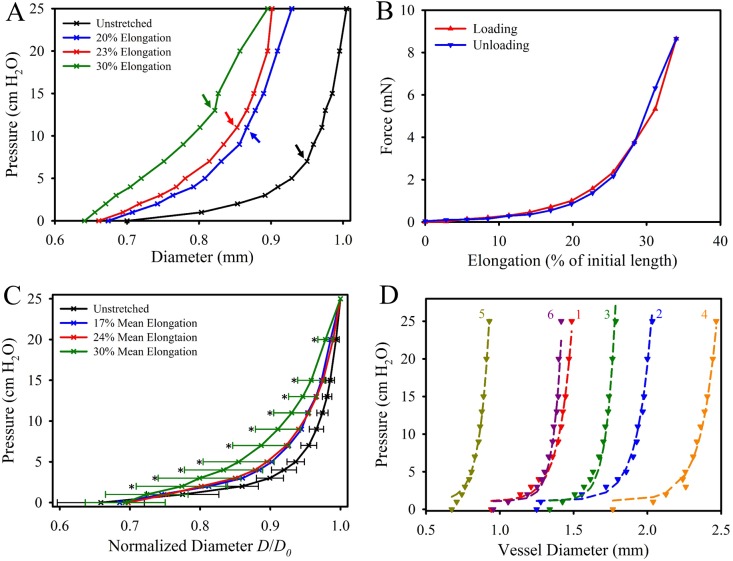
Fig 2. Biomechanical testing of cannulated lymphatic vessels.
(A) Pressure-diameter relationship for a representative specimen at various states of elongation (0%, 20%, 23% and 30% for this specimen). The transition pressure between the low-stiffness and high-stiffness response at each elongation level is indicated by the colored arrows. (B) Force-elongation relationship for the same representative specimen at a pressure of 5 cm H2O. (C) The mean pressure-normalized diameter for the 6 specimens in the unstretched (black), 20% (blue), 23% (red), and 30% elongation (green) states. Error bars indicating standard deviation where only included for the 0% and 30% data for clarity (others were similar in value). An asterisk indicates a significant statistical difference detected via T-test between the 0% and 30% data for a given pressure level. (D) Pressure-diameter data from each of the six specimens (dashed lines) and the resulting fit parameters of Eq 1 as listed in Table 1 (markers).

