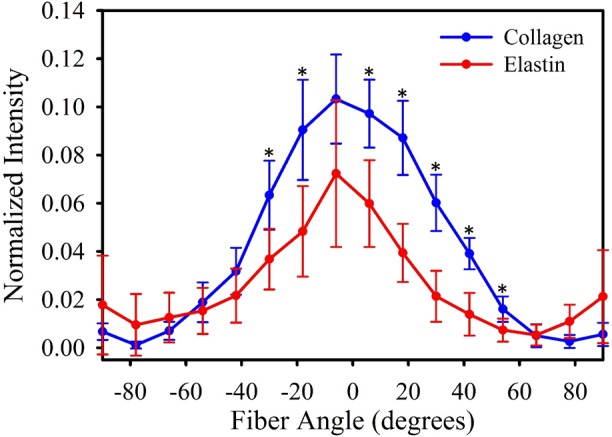
Fig 4. Collagen and elastin orientation as quantified by FFT.

The mean collagen fibre orientation from the 6 specimens is given in blue, and the mean elastin orientation is given in red. Error bars indicate standard deviation. Orientation angles from -90° to 90°, with the axial length of the vessel orientated at 0°. Asterisks indicate a significant statistical difference between collagen and elastin orientation as detected via T-test.
