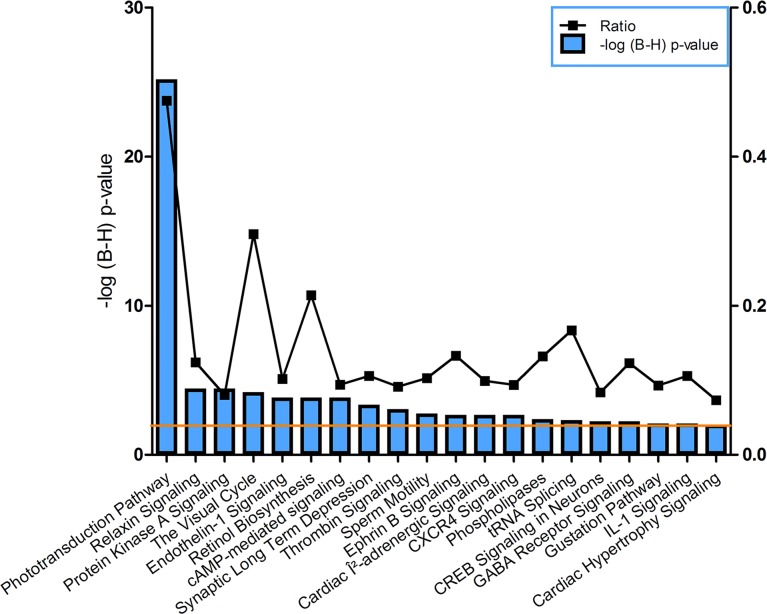
Fig 2. Canonical pathways identified by Ingenuity for the RPE enriched genes.
The left y-axis displays the–log of the Benjamini-Hochberg corrected p-value. The right y-axis displays the ratio of number of genes derived from our dataset, divided by the total number of genes in the pathway. The bar graph represents the -log(B-H) p-value. The orange line indicates the threshold at a Benjamini-Hochberg corrected p<0.01.

