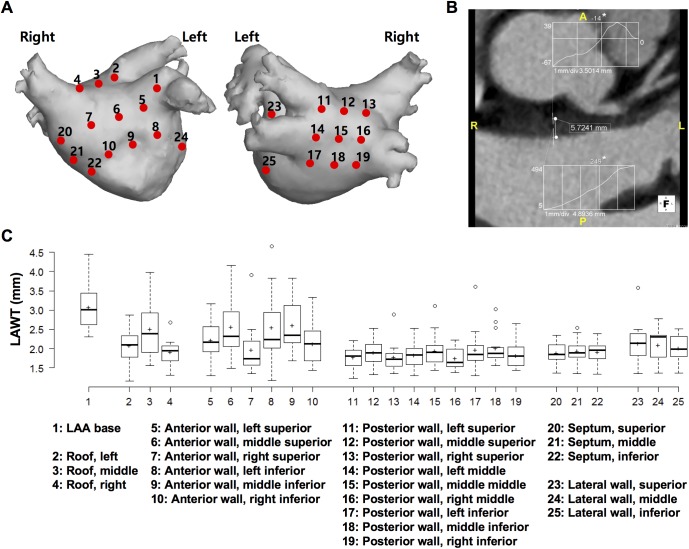
Fig 1. Measurement of LAWT at 25 preselected left atrial locations.
(A) Schematic representation of the 25 preselected left atrial locations including 3 at the atrial roof, 1 at the anterior appendage base, 6 at the anterior wall, 9 at the posterior wall, 3 at the septum, and 3 at the lateral wall. (B) Measurement of LAWT at the middle superior anterior wall. LAWT was measured semi-automatically between the inner and outer borders through a histogram and a line segment tool by using software. In inset graphs, the numbers in the y-axes denote the extreme computed tomography (CT) numbers of the two short lines across the LA wall and epicardial fat and LA wall and LA cavity. Numbers marked with an asterisk represent the median CT numbers from the full width at half-maximum method, which correspond with the dots on the line across the LA wall. (C) Standard box plots of regional LAWT with average LAWT (marked by “+”) are shown for each preselected location. LA, left atrium; LAA, left atrial appendage; LAWT, left atrial wall thickness.

