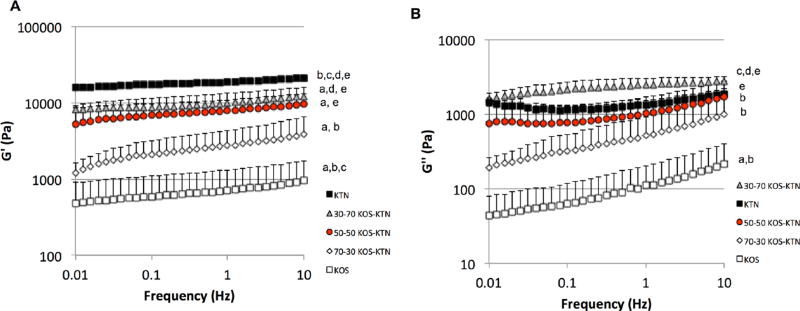
Figure 2.
Rheological data for each formulation. (A) G’ (elastic modulus) and (B) G” (viscous modulus) for frequency sweep from .01 to 10 Hz. Error bars indicate standard deviation and n = 3 for each formulation. The trend indicates increasing elastic modulus with increasing levels of disulfide crosslinking (increasing levels of KTN). For statistical comparisons (one-way ANOVA followed by Tukey’s post hoc test): a indicates P < 0.05 vs. KTN; b indicates P < 0.05 vs. 30:70 KOS:KTN; c indicates P < 0.05 vs. 50:50 KOS:KTN; d indicates P < 0.05 vs. 70:30 KOS:KTN; and e indicates P< 0.05 vs. KOS.

