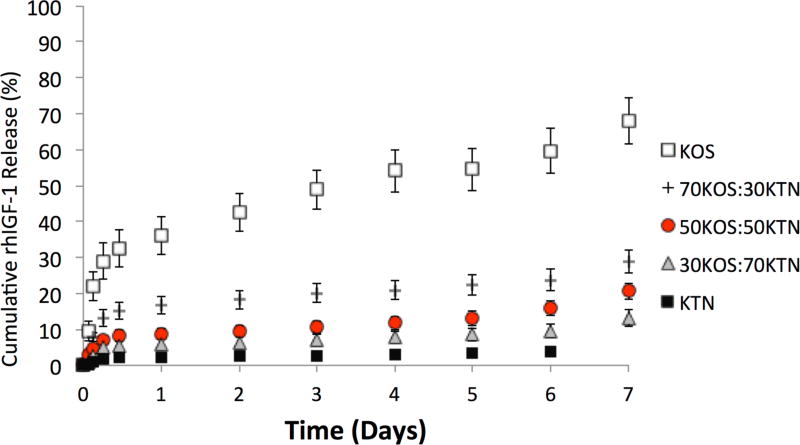
Figure 7.
Release of rhIGF-1 from keratin gels with time. Each sample was loaded with 100µg of rIGF-1 per mL of keratin hydrogel. Each data point represents cumulative release as a percentage of initial rhIGF-1 loading. The rates of release can be seen to correlate with the rates of erosion seen in Figure 6. Error bars represent standard deviation and n = 4 for each formulation. Each formulation was statistically different than every other formulation by the ~12 hour time point except that 30:70 and 50:50 KOS:KTN did not reach statistical significance until day 6.

