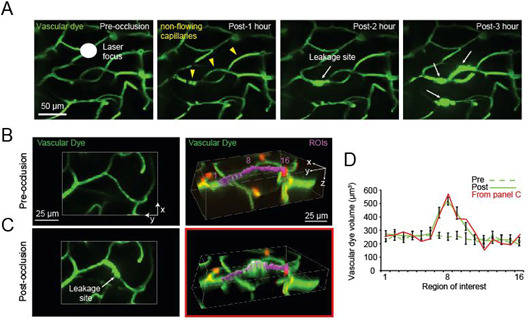
Figure 3. In vivo observation and post-hoc quantification of capillary leakage.

A. In vivo tracking of capillary leakage over 3 h following photothrombotic irradiation of cortical capillaries; B. Two-dimensional (left) and 3-dimensional (right) representation of capillaries before irradiation. Sixteen ROIs (purple) are strung along a capillary segment in the 3-dimensional panel, with ROI 8 positioned at the central point of leakage. C. The same vessels are shown 1 h after irradiation, when fluorescein-dextran leakage is evident. D. Graph of fluorescein-dextran volumes pre (dotted line) and post (solid line) irradiation, corresponding to the capillary leakage site. The post-irradiation dye volume trace for data of panel C is shown as the solid red line.
