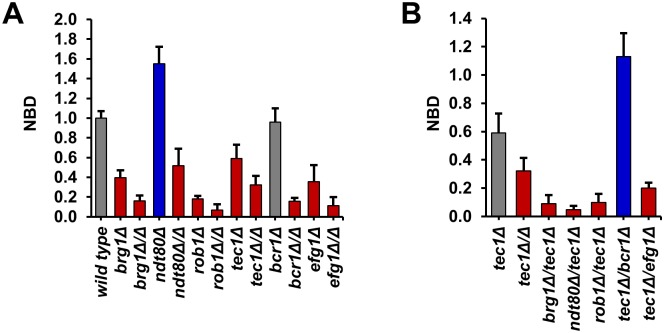
Fig 1. Heterozygous deletion mutants of six core biofilm transcription factors show simple and complex hapoinsufficiency for biofilm density.
(A) The density of the biofilms formed by the indicated wild type (SN250), heterozygous and homozygous deletion strains was determined by measuring the OD600 after incubation for 48 hr as described in Materials and Methods (YETS medium). The raw data were normalized to wild type: Normalized Biofilm Density (NBD) = OD600 mutant/OD600 wild type. Data are representative of results obtained on at least three different days. Bars are the mean of three or four independent well replicates. Error bars are standard deviation. Red and blue bars indicate statistically significant reduction and increase from wild type, respectively (Student’s t test, P<0.05). Grey bars indicate no change. (B) The interaction profile for the interactions of tec1Δ/TEC1 with all five other network TFs is shown. Bars are the mean of three or four independent well replicates. Error bars are standard deviation. Red and blue bars indicate statistically significant reduction and increase from the tec1Δ/TEC1 heterozygote, respectively (Student’s t test, P<0.05). Grey bars indicate no change.

