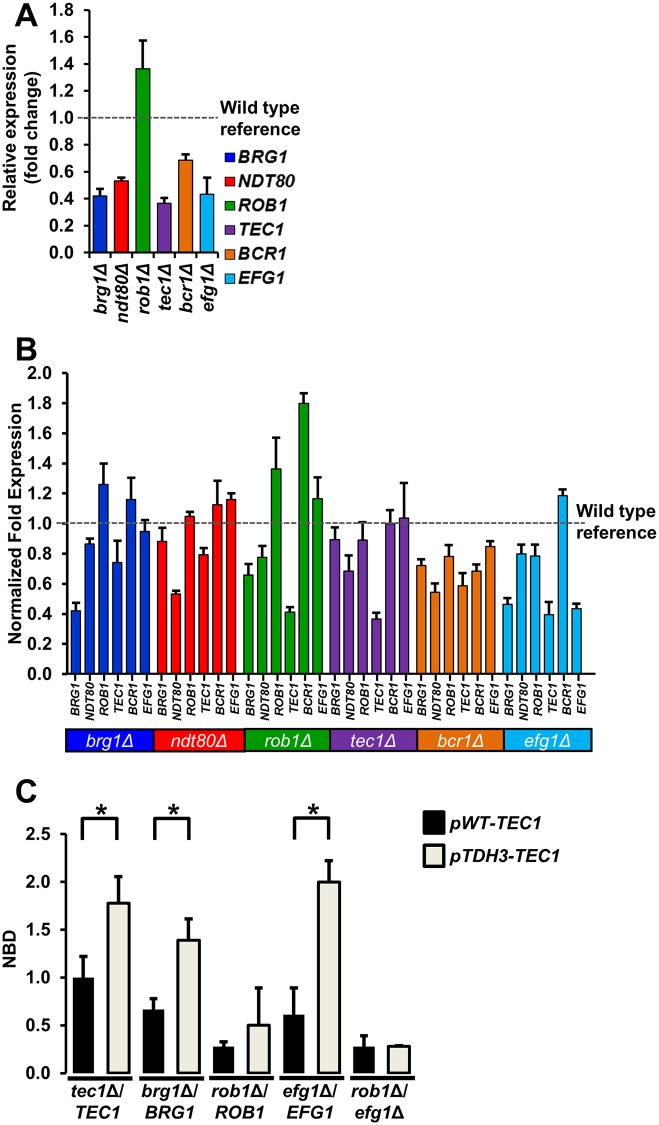
Fig 2. Heterozygous biofilm trancription factor mutants show haploinsufficient expression of network transcription factors.
(A) The expression of each of the six biofilm TFs (BRG1, BCR1, EGF1, NDT80, ROB1, and TEC1) was measured by qRT-PCR in the corresponding heterozygous deletion mutant of that TF after 48hr biofilm formation and expressed relative to WT (SN250). The bars indicate mean relative expression for three or four independent experiments performed in triplicate and error bars are SEM. (B) The expression of each of the six core biofilm TF was determined for all six of the heterozygous TF deletion mutants after 48 hr biofilm conditions. The expression levels for each gene are normalized to WT (SN250) under the same conditions. Each bar represents the mean of three independent experiments performed in triplicate. The error bars indicate SEM. (C) The normalized biofilm densities (NBD), OD600 mutant/OD600 tec1Δ/TEC1 pWT-TEC1, at 48hr are shown for the indicated strains. Strains with the pWT-TEC1 designation have both TEC1 alleles expressed from the endogenous promoter. Strains with the in pTDH3-TEC1 designation contain one allele of TEC1 regulaed by the TDH3 promoter. Data are representative of results obtained on at least three different days. Bars are the mean of three or four independent well replicates. Error bars are standard deviation. Brackets with asterisks indicate a statistically significant difference between the two means (P<0.05, Student’s t test). Absence of a bracket and asterisk indicates that there is no significant difference between means.

