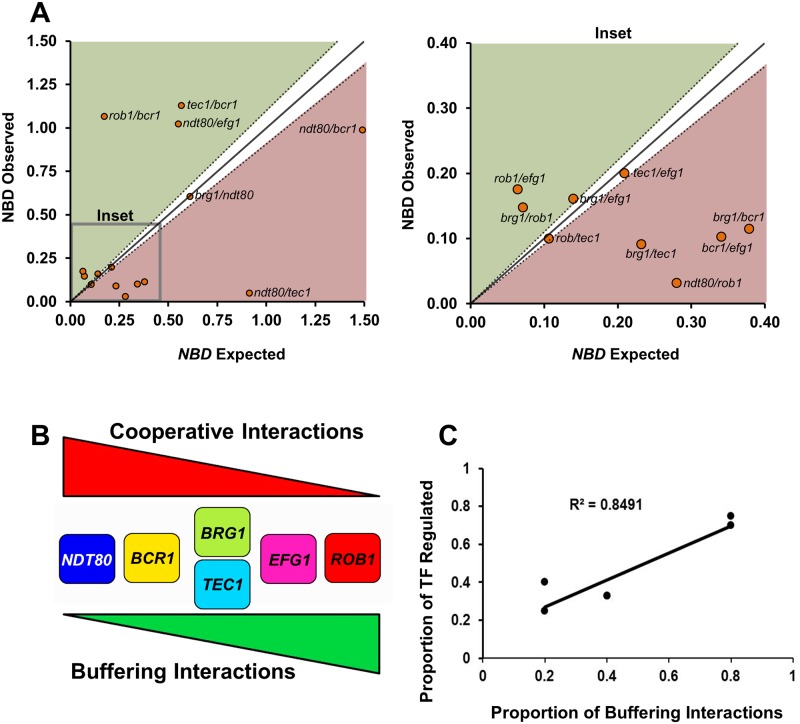
Fig 7. Epistasis analysis of the biofilm density for the biofilm TF network.
(A) The nomarlized biofilm density (NBD) for each double heterozygote mutant was determined after 48 hr biofilm formation as described in Materials and Methods. The predicted NBD for each double heterozygous mutant was calculated by multiplying the NBD scores for each single mutant: NBDdh12 = NBDsh1 x NBDsh2, where dh12 is double heterozygote of single heterozygotes sh1 and sh2. The expected NBDdh12 is plotted against the observed NBDdh12. NBDdh12 scores that plot on the diagonal (solid line with estimated error indicated by dotted line) indicate no genetic interaction (independence) between the single mutants and correspond to Ɛ = 0; NBDdh12 below the diagonal have Ɛ <0 indicating an cooperative interactions; NBDdh12 above the diagonal have Ɛ > 0 indicating a buffering interaction. The plot on the left is an inset showing the details of the area indicated. The full data set for biofilm formation of all strains used to generate this data and calculations are provided in S2 Table. Strains with error that overlapped with the estimated error of the predicted NBDdh12 were considered to have no interaction. (B) Profile of cooperative and buffering interactions for each TF. (C) Correlation between number of buffering interactions and the number of network TF bound by that TF based on previously reported chromatin immunoprecipitation data. Pearson correlation coefficient is shown. Please note that BRG1 and TEC1 have identical numbers of buffering interactions and thus the data points overlap.

