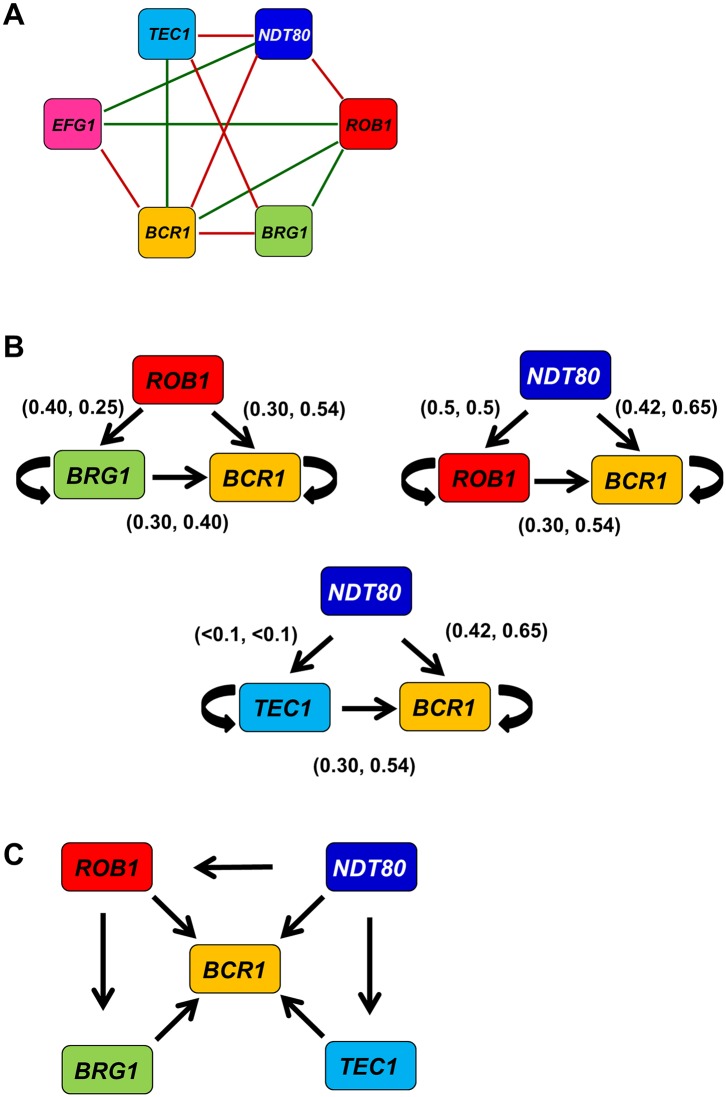
Fig 8. The biofilm TF network contains feedforward loops that regulate BCR1 expression.
(A) A summary of the phenotypic genetic interaction network for the biofilm TFs. (B) Three network modules that show both phenotypic interactions and downstream target expression changes consistent feedforward loops. The numbers in parenthesis over each arrow indicate the fold change in expression of the upstream and downstream TF (upstream, downstream) in the corresponding double mutant as compared to each single mutant. The arrows indicate that the double mutant has reduced expression of the TF at the head of the arrow. The circular arrrows indicate auto-regulation. All indicated expression changes are statistically significant (P < 0.05) and the primary data are provided in S2 Table. (C) The higher level module that results in the combination of the three feed-forward loops.

