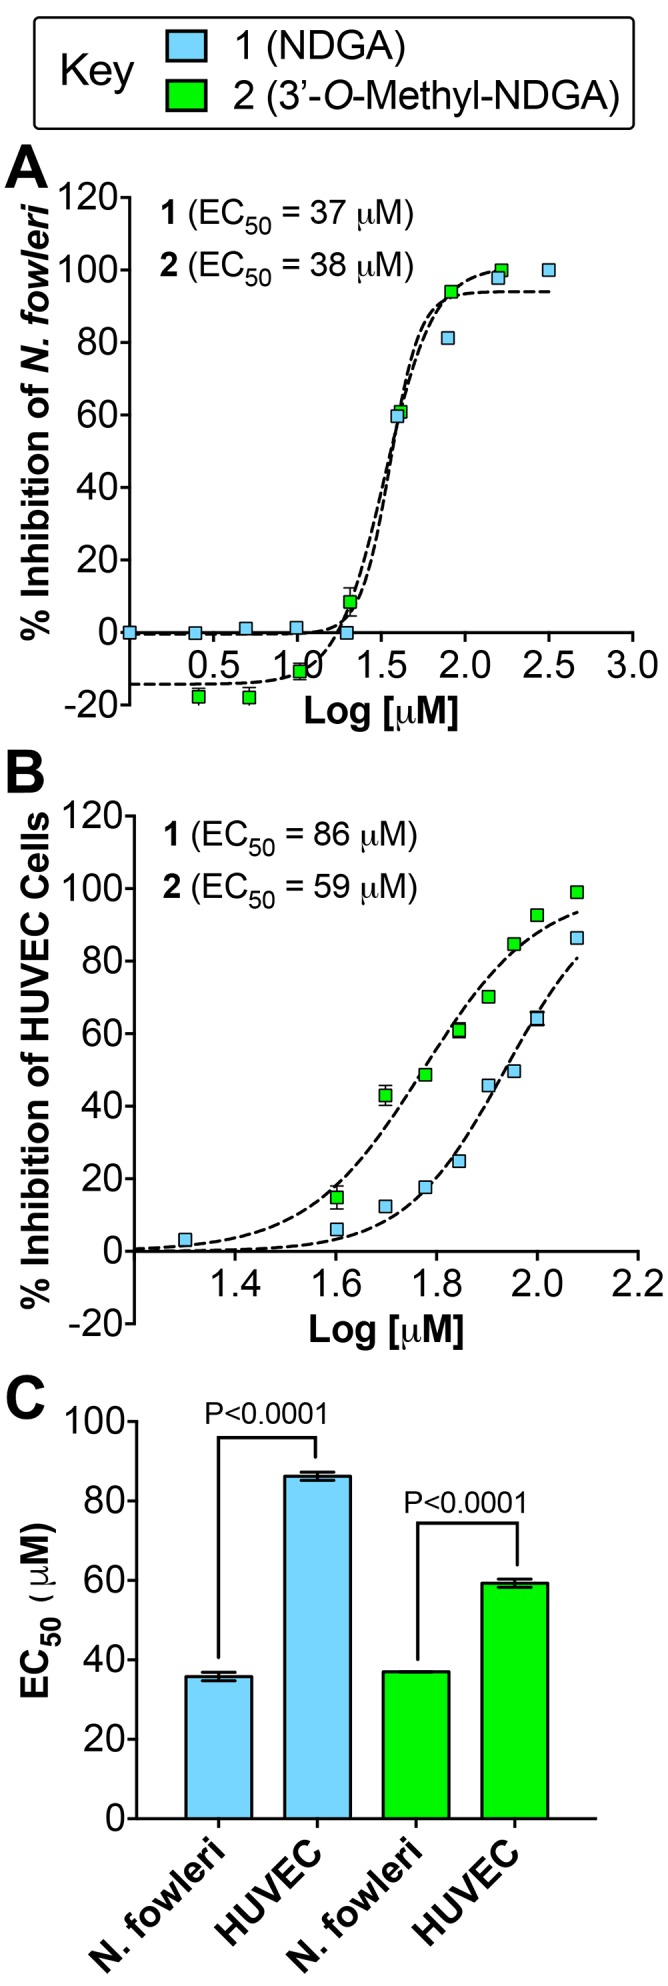
Fig 5. Percent inhibition of N. fowleri and human HUVEC cell proliferation by 1 and 2.

(A) The EC50 dose response curves for 1 and 2 against N. fowleri trophozoites. (B) The EC50 dose response curves for 1 and 2 against HUVEC cells. (C) Compound 1 and 2 displayed more potent inhibition of N. fowleri proliferation compared to HUVEC cells, which was statistically significant by Student’s t test analysis.
