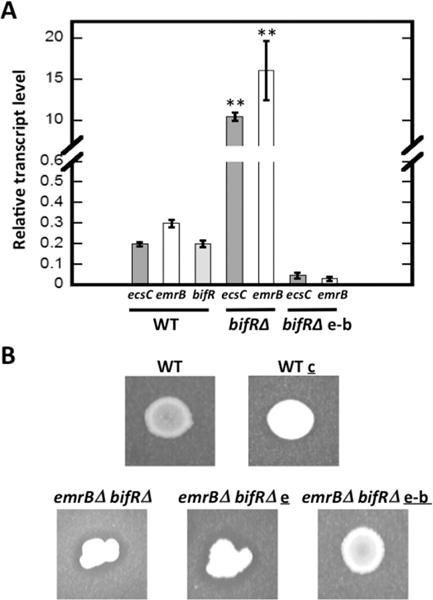
Figure 2.

Regulation of gene expression. (A) Relative transcript level of ecsC, emrB, and bif R in wild type (WT) strain and ecsC and emrB in bif RΔ and bif RΔ e-b strain (complemented with emrB-bif R) calculated using relative to reference gene encoding glutamate synthase large subunit (BTH_I3014/BTH_RS27550). Error bars represent standard deviation of three separate experiments (each with three technical replicates). Asterisks represent statistical significance from WT based on Student’s t test (p < 0.001). (B) Elastin cleavage activity in WT and emrBΔ-bif RΔ strains and emrBΔ-bif RΔ complemented with emrB (emrBΔ-bif RΔ e) or with emrb-bif R (emrBΔ-bif RΔ e-b); WT c carries vector without genes inserted. Plates contain insoluble elastin and clearing zone reflects elastin cleavage.
