
Figure 6.
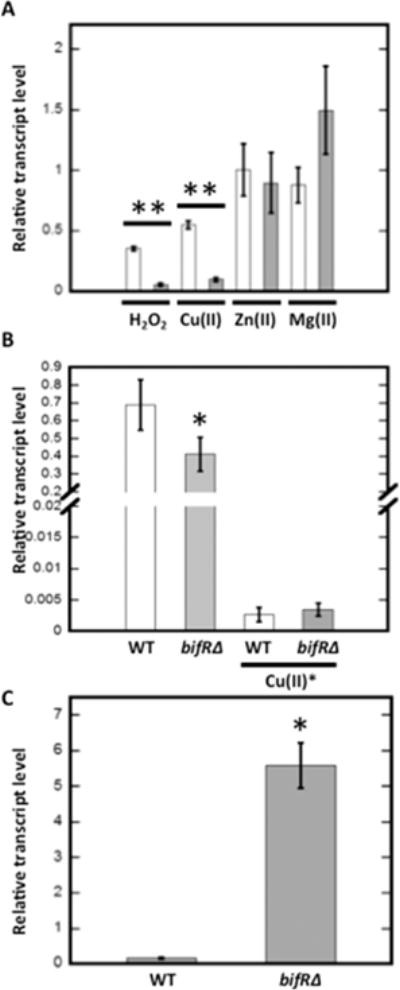
Regulation of gene expression by metals and oxidants. (A) Relative abundance of transcript level of emrB (open bars) and bif R (gray bars) after addition of 1 mM H2O2, 1 mM CuCl2, 1 mM ZnCl2, or 30 mM MgCl2. The transcript level was calculated using relative to the reference gene glutamate synthase large subunit, and the comparative CT method was used to calculate relative abundance with reference to the transcript level of unsupplemented control samples. (B) Relative transcript level of Nudix pyrophosphatase (BTH_I2657/BTH_RS25735) in WT and bif RΔ strains calculated using relative to the reference gene glutamate synthase large subunit. The relative abundance of transcript level of the gene encoding Nudix pyrophosphatase in 1 mM CuCl2 treated WT and bif RΔ strains was calculated using relative to the reference gene glutamate synthase large subunit and the comparative CT method was used to calculate relative abundance with reference to the transcript level of unsupplemented control samples (in samples marked by asterisk). (C) Relative transcript level of PCA biosynthetic gene phzF in WT and bif RΔ strain calculated using relative to reference gene encoding glutamate synthase large subunit. Error bars represent standard deviation of three experiments. Asterisks represent statistical significance from unsupplemented WT based on Student’s t test (*, p < 0.05 and **, p < 0.001 for both emrB and bif R expression in the presence of oxidants).