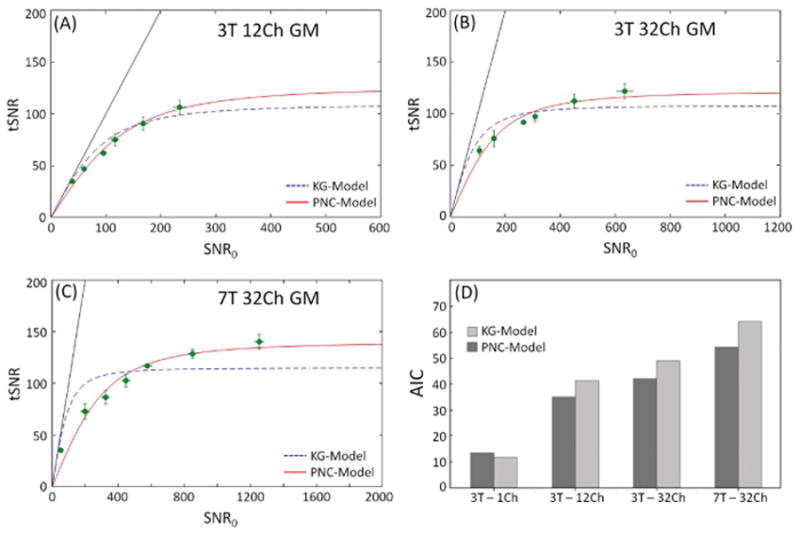
Figure 1.

Time-series SNR (tSNR) as a function of SNR0 for 3T 12Ch (A) and 32Ch (B) coils, (C) 7T 32Ch array using both models. The dotted line is the fit to the KG-model and solid line is the PNC-model. Each circle corresponds to one of the six spatial resolutions examined, from left to right 1×1, 1.5×1.5, 2×2, 3×3, 4×4, 5×5 mm2 in-plane and a fixed slice thickness of 3 mm. Measurements derived from areas of cortical gray matter ROIs and averaged over all subjects. Six resolutions were used at 3T, while seven resolutions were used at 7T. In (D) the AIC of the fit to each model is shown. All data reconstructed using the rSoS combination method.
