
Figure 2.
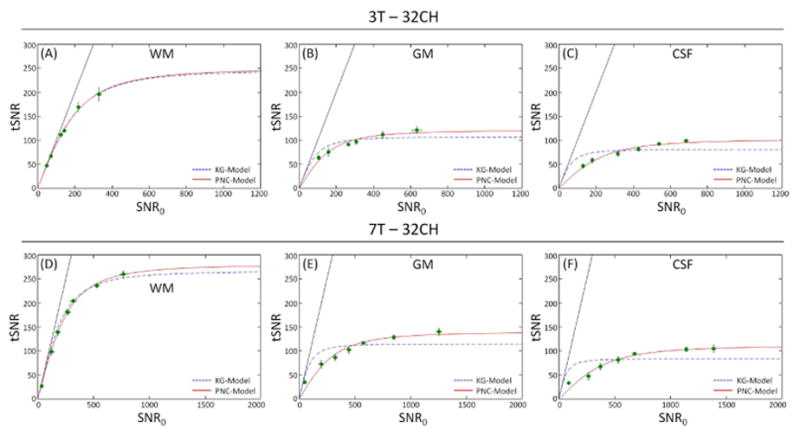
SNR in fMRI time-series (tSNR) as a function of image SNR (SNR0) for different tissue classes (WM, GM and CSF) for the 3T (A, B, C) and 7T (D, E, F) 32Ch array data when image SNR was modulated with voxel size. Each point represents the average and SD error bars over all subjects, (because of their small size, some of the error bars are contained within the symbols). The dotted line is the fit to the KG-model (Eq. 4) and solid line corresponds to the PNC-model (Eq. 13). All data reconstructed using the rSoS combination method.