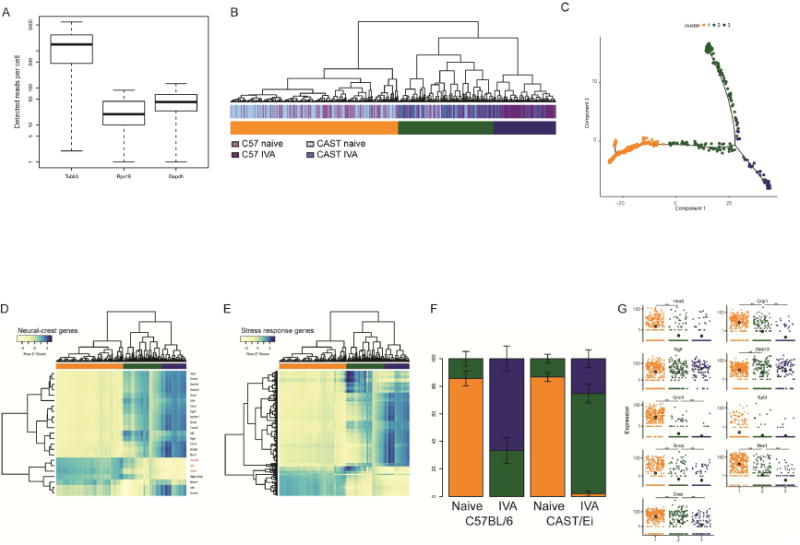
Fig. 5. scSeq highlights the existence of two distinct clusters of DRG neurons.

(A) Absolute read count detected for Tubb3, Rps16 and Gapdh showing that Tubb3 is detected in each of the sequenced cell, confirming their neuronal identity. (B) Hierarchical clustering of the single cell RNAseq sample according to the expression of the 2,000 genes contributing the most to the transcriptional profile. Three broad clusters (color coded in orange, green, and blue) are identifiable. (C) Result of chronologically ordering the cells along pseudotime using the top 2000 genes identified. The orange (mostly naive) cells mark the beginning of the pseudotime course. The cells belonging to the green cluster are found at the interface between those belonging to the orange and the blue clusters. (D) Heatmap representation of the expression of genes related to neural crest. The three genes (Isl1, Pouf1 and Ntrk1) that are turned on when cells commit to differentiation and exit cell cycle are highlighted in red. (E) Heatmap representation of the expression of the genes annotated as “Cellular response to stress”. (F) Proportion of cells found in each of the two groups identified in A for each of the sample type; color-coded as in A. (G) Expression level of nine expressed Ascl1 target genes as assessed by scRNAseq showing that Ascl1 targets are preferentially expressed in the cells of the orange and green clusters. The large dot in each group represents the trend expression level of this group.
