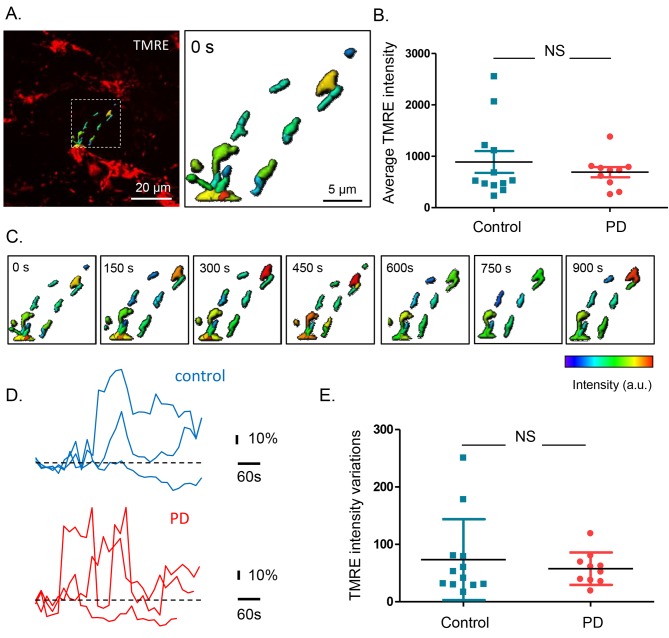
Figure 3. Mitochondrial membrane potential measurements in the submucous plexus of PD patients and controls.
(A.) Representative example of a TMRE injection in the submucous plexus of a control subject. A subset of mitochondria was selected to show the TMRE intensity differences (as color-coded) in individual mitochondria. (B.) Summary data plot of the TMRE intensity in mitochondria of patients and controls (NS, not significantly different, p-value=0.49 (non-parametric Wilcoxon T-test). (C.) Example of a time series (900 s) of color-coded TMRE intensity fluctuations in individual mitochondria (see selection in A.). (D.) Graphs showing TMRE intensity variations (%) over time of three individual mitochondria of control and PD patient, suggesting similar dynamics in patients and controls. (E.) Summary data plot of the average TMRE intensity fluctuations for controls and PD patients. (NS, not significantly different, p-value=0.99, non-parametric Wilcoxon T-test).
DOI: http://dx.doi.org/10.7554/eLife.26850.011
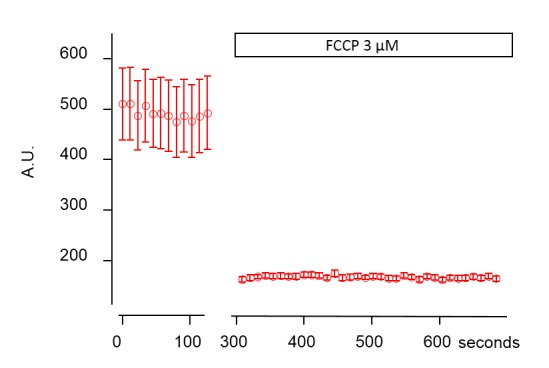
Figure 3—figure supplement 1. Mitochondrial TMRE destaining in the submucous plexus after addition of FCCP.


