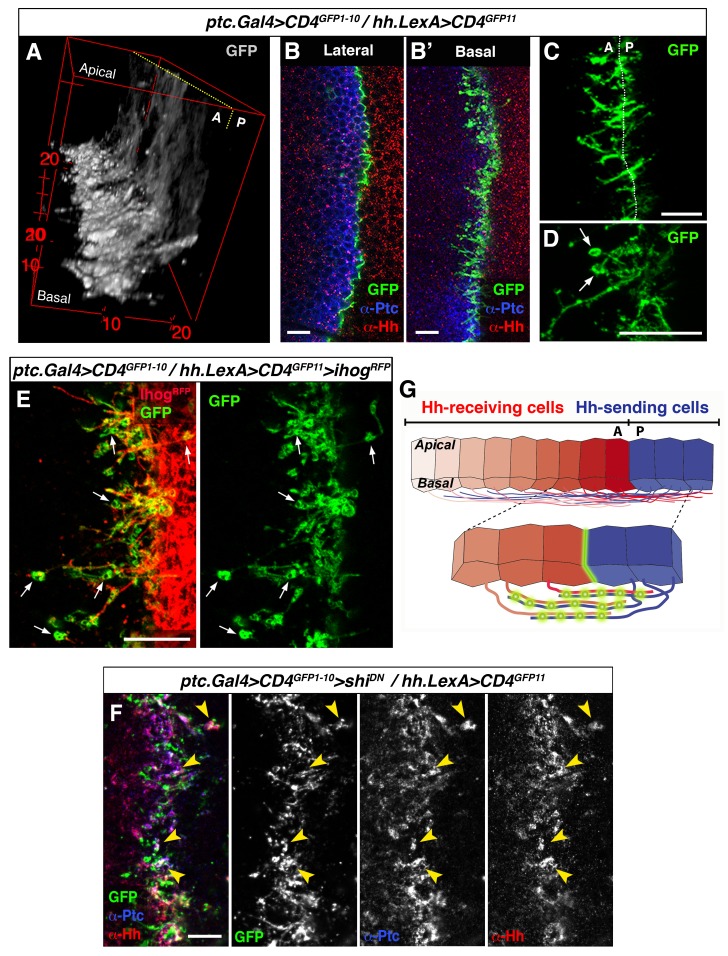
Figure 4. GRASP showing cytoneme-cytoneme interaction at the A/P compartment border.
(A) 3D view of a ptc.Gal4, tub.Gal80ts>UAS.CD4-GFP1-10 / hh.LexA>LexAop.CD4-GFP11 wing disc after 24 hr at the restrictive temperature. (B, B’) A wing disc of the same genotype as in A co-labelled with α-Ptc and α-Hh antibodies. Note the GFP complementation at the A/P compartment border in a lateral (B) and a basal section (B’). (C, D) Basal sections showing GRASP fluorescence in similar wing discs. Cytonemes cross the A/P compartment border from A to P and from P to A (C). Annular rings are visualized along these interacting cytonemes (D, arrows). (E) A ptc.Gal4, tub.Gal80ts>UAS.CD4-GFP1-10 / hh.LexA>LexAop.CD4GFP11>LexAop.ihogRFP wing disc after 24 hr at the restrictive temperature to visualize Ihog labelled cytonemes emanating from the P compartment. Note the GRASP signal in the circular structures attached to cytonemes (arrows). (F) A ptc.Gal4, tub.Gal80ts>UAS.CD4-GFP1-10>UAS.shiK44A / hh.LexA>LexAop.CD4-GFP11 wing disc after 12 hr at the restrictive temperature and co-labelled with α-Hh and α-Ptc antibodies. Note the colocalization of GRASP, Ptc and Hh in the same structures at the most basal part of the disc (arrowheads). (G) Diagram depicting cytoneme interactions at the A/P compartment border. The green colour corresponds to the GRASP signal at the A/P compartment border and also at the specific sites for Hh reception along overlapping cytonemes. The data shown were consistent in at least four independent experiments with an average of 8 discs in each experiment. Bars, 10 µm.

