. 2017 Aug 21;6:e24045. doi: 10.7554/eLife.24045

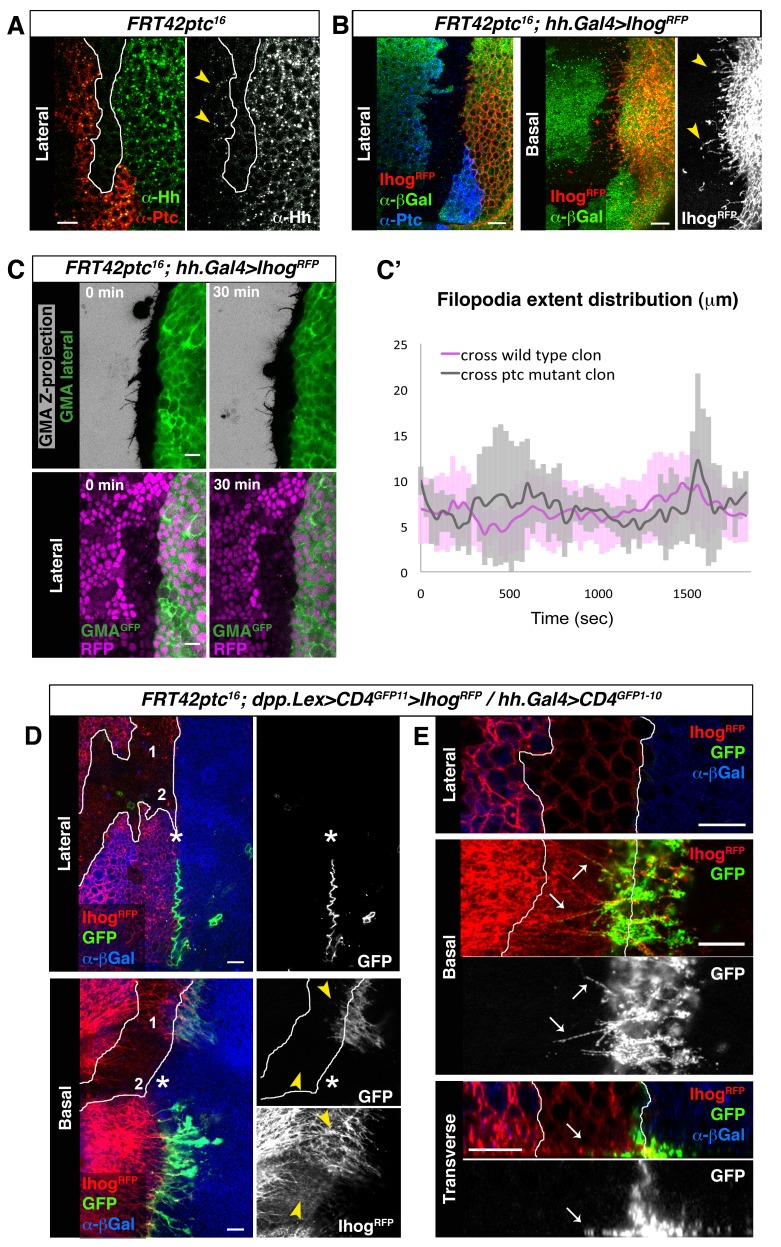
Figure 5. Cytonemes cross ptc−/− mutant clones at the A/P compartment border.

(A) A ptc16 null clone in the A compartment abutting the A/P compartment border of a wing disc co-labelled with α-Hh and α-Ptc antibodies. Note that both Ptc and Hh proteins are detected anterior to the clone in the A compartment (arrowheads). (B) P compartment cytonemes extend through a ptc−/− clone (arrowheads). Lateral and basal sections of a ptc−/− clone (absence of βGal) in the A compartment with Ihog-RFP expression in the P compartment to visualize cytonemes (FRT42D ptc16 / hh.Gal4, tub.Gal80ts>UAS.ihog-RFP wing disc after 24 hr at the restrictive temperature) co-labelled with α-βGal and α-Ptc antibodies. (C) First and last time frames from Video 6 displaying a lateral view of GMA-GFP signal to easily visualize cell perimeters together with a Z-projection of GMA-GFP where filopodia are shown (top panels) or with a lateral view of nuclear RFP to distinguish between wild-type (magenta nuclei) and ptc−/− mutant (absence of magenta nuclei) territories (bottom panels). Scale bars represent 10 μm. (C’) Graph showing extent distribution over time of GMA-GFP filopodia emanating from Hh-producing cells. Notice that there is no difference between filopodia crossing a wild-type (magenta) or a ptc−/− mutant (grey) clone territories. (D) A ptc16 clone induced in the A compartment abutting the compartment border in a dpp.LexA>LexAop.CD4-GFP11>LexAop.ihog-RFP / tub.Gal80ts, hh.Gal4>UAS.CD4-GFP1-10 wing disc after 24 hr at the restrictive temperature and labelled with α-βGal antibody to identify the mutant clone (absence of βGal). Note the GRASP signal is not visualized laterally (asterisk). Note also that basal cytonemes cross the ptc−/− clone in region 1 but not in region 2, and that the GRASP signal is restricted to region 1 and absent from region 2 (arrowheads). E) Another ptc−/− clone induced in a disc with the same genotype as in D showing the interaction between cytonemes from wild type cells anterior to the clone and cytonemes from the P compartment. Note the GRASP signal along basal cytonemes from wild type A compartment cells that traverse the ptc−/− clone (arrows). The data shown were consistent in at least three independent experiments with an average of 5–10 discs in each experiment. Bars, 10 µm.

DOI: http://dx.doi.org/10.7554/eLife.24045.017

Figure 5.

Figure 5—figure supplement 1. Cytonemes from Hh-producing cells are still formed in mutants that modify Hh reception.

Figure 5—figure supplement 1.

(A, A’) A hh.LexA>LexAop.ihog-RFP wing disc labelled with α-Ci antibody to show Hh signalling (A’). (B, B’) A ptc.Gal4, tub.Gal80ts>UAS.ptc-RNAi; hh.LexA>LexAop.ihog-RFP disc labelled with α-Ci antibody to monitor the full activation of the Hh pathway in the absence of Ptc by the low levels of Ci (B’). Note that cytonemes remain similar independently of the presence of Ptc in the A compartment (A, B). (C, C’) A ptc.Gal4, tub.Gal80ts >UAS.smo-RNAi / hh.LexA>LexAop.ihog-RFP wing disc stained with α-Smo antibody to monitor the degree of Smo knock down. Note that cytonemes are similar with (A) or without (C) the presence of Smo in the A compartment. (D, D’) A ptc.Gal4, tub.Gal80ts >UAS.ihog-RNAi>UAS.boi-RNAi / hh.LexA>LexAop.ihog-RFP wing disc co-labelled with α-Ptc and α-Ci antibodies to monitor the low levels of Hh signalling in the absence of Hh co-receptors Ihog and Boi. Note that cytonemes are similar with (A) or without (D) the presence of both Ihog and Boi in the A compartment. All larvae (A–D) were grown 30 hr at the restrictive temperature before dissection. The data shown were consistent in at least three independent experiments with an average of 5–10 discs in each experiment. Bars, 10 µm.
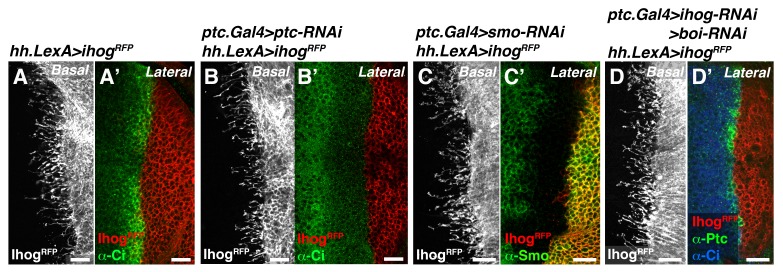
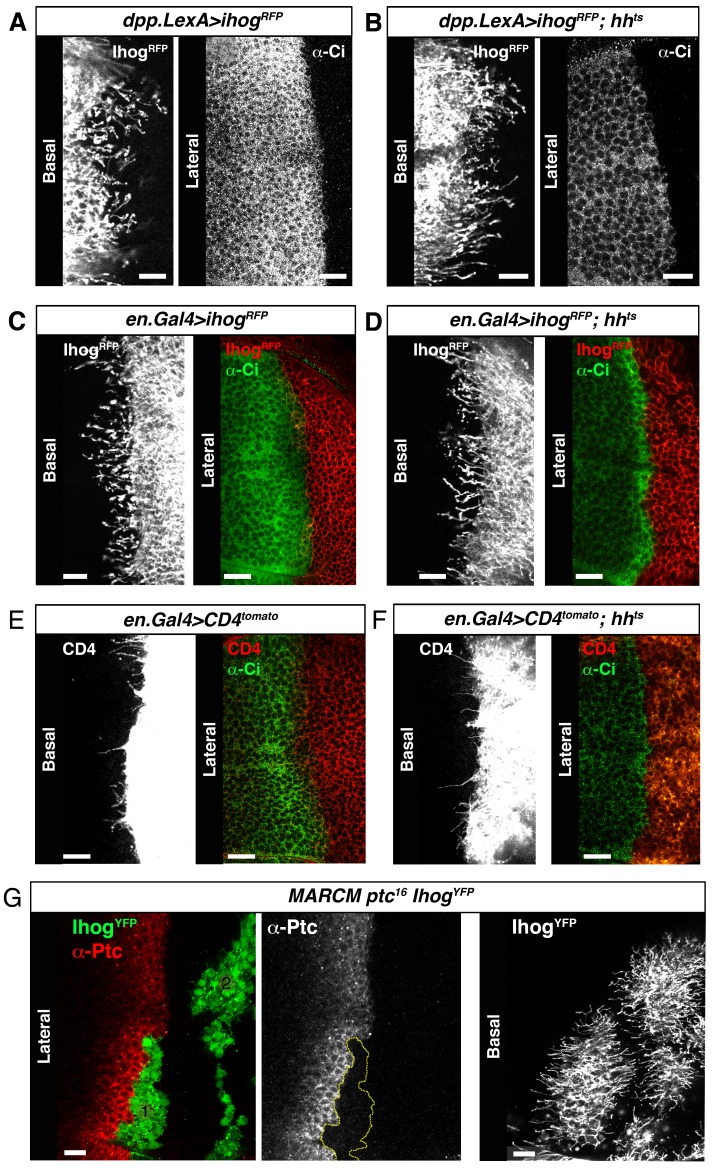
Figure 5—figure supplement 2. Cytonemes are still present in absence of Hh ligand.

Figure 5—figure supplement 2.

(A) A dpp.LexA>UAS.ihog-RFP wing disc stained withα-Ci antibody to monitor the activation of the Hh pathway. (B) A dpp.LexA>LexAop.ihog-RFP / hhts2 wing disc shows by the low levels of Ci in the A compartment the lack of activation of the Hh pathway. Note that the A compartment cytonemes are not affected in the absence of Hh. (C) An en.Gal4>UAS.ihog-RFP wing disc stained with α-Ci antibody. (D) An en.Gal4>UAS.ihog-RFP / hhts2 wing disc where the absence the Hh signal is monitored by the low levels of Ci activation. (E) An en.Gal4>UAS.CD4-tomato wing disc stained with α-Ci antibody. (F) An en.Gal4>UAS.CD4-tomato / hhts2 wing disc and stained with α-Ci antibody to check the absence the Hh signal. Note that the P compartment cytonemes labelled either by Ihog (D) or CD4 (F) are not affected by the absence of Hh. (G) MARCM ptc16 UAS.ihog-YFP clones induced in A (marked with yellow line) and P compartments of a wing disc and stained with α-Ptc antibody to see the knock down of Ptc and the localization of the anterior clone at the A/P compartment border. Observe that the absence of Ptc does not affect the formation of cytonemes autonomously. Bars, 10 µm.
Figure 5—figure supplement 3. Manual tracking of filopodia arising from Hh-producing abdominal histoblasts cells crossing either a ptc mutant or a wild-type territories.

Figure 5—figure supplement 3.

(A) Table showing the maximum extent (Emax), lifetime, and elongation (Ve) and retraction (Vr) velocities of filopodia from Hh-producing cells crossing wild type and ptc−/− territories to the A compartment. (B, C) Violin plots representing the filopodia Emax (B) and lifetime (C). Notice that there are not significant differences between filopodia crossing ptc mutant or wild-type territories (n.s.). (D, E) Violin plots representing the Ve (D) and Vr (E) as trapezoid (T) or triangle (t) models. (F, G) Percentage graphs representing the type of elongation (F) and retraction (G) velocities of filopodia crossing ptc mutant (ptc−/−) or wild-type (WT) territories.