
Figure 2.
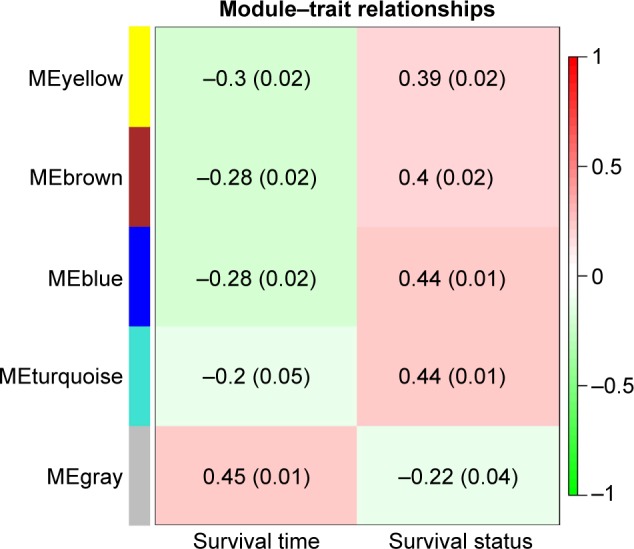
Module–trait relationships. Each row corresponds to a color module and column to clinical features (survival time and survival status). Each cell contains the corresponding relational value (r) in the first line and the P-value in the second line.
Abbreviation: ME, module eigengenes.