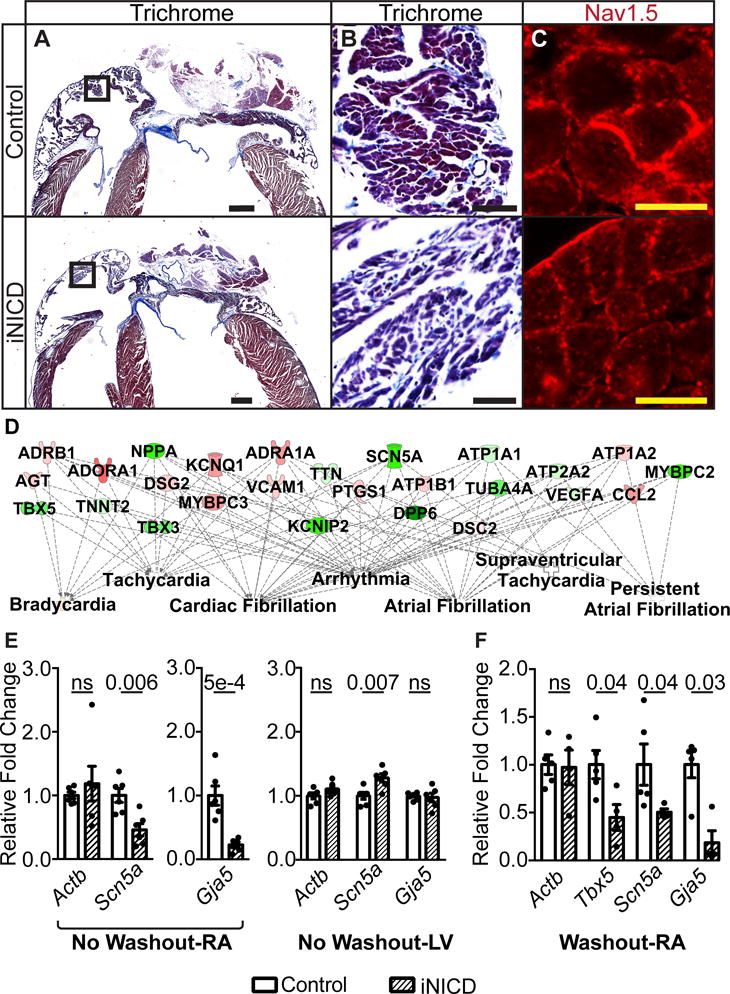
Figure 5. Transient Notch activation correlates with a transcriptional signature of atrial arrhythmias.

(A,B) Masson’s Trichrome staining demonstrates a grossly normal atrial size in iNICD mice. Boxed region within Panel A (scale bar=500 μM) is enlarged in Panel B (scale bar=50 μM) to reveal comparable levels of fibrosis in control and iNICD mice. Quantification of atrial cardiomyocyte cell size and collagen levels also revealed no differences (Supplemental Figure XI). (C) Nav1.5 immunostaining indicates proper localization to the sarcolemma in iNICD mice. Scale bar=10 μM. Representative images are from n=3 controls (αMHC-rtTA on doxycycline) and n=3 iNICD (αMHC-rtTA; tetO_NICD). In A–C, Notch was induced at 8 weeks of age for 3 weeks with no washout period. (D) RNA-sequencing was performed on 6 iNICD (α-MHC-rtTA; tetO_NICD, n=3 female, n=3 males) and 6 control (α-MHC-rtTA, n=4 female, n=2 males) RA from mice fed doxycycline for 3 weeks starting at 8 weeks of age with no washout period. The total number of differentially expressed transcripts is 910, and this set of differentially expressed genes was further analyzed using Ingenuity Pathway Analysis (IPA). Of the top 25 statistically significant Ingenuity Pathway generated disease or function network categories associated with this gene set, 10 of 25 are related to arrhythmias and 7 of 25 are related to atrial arrhythmias (Supplemental Table V). The FDR adjusted P value predicts existence of bias in gene regulation, with P values <0.05 considered statistically significant. Select disease categories are shown in a plot that also represents the key differentially expressed genes within the category. The green color represents genes that are down-regulated and red represents up-regulated genes, while a higher intensity of color indicates a higher fold change. RT-qPCR validation of genes that factor most prominently in the IPA analysis disease association is presented in Supplemental Table VI. (E) RT-qPCR of select genes demonstrates Scn5a and Gja5 down-regulation in iNICD RA after acute Notch activation. In contrast to the RA, RT-qPCR demonstrates Scn5a up-regulation in iNICD LV. iNICD (αMHC-rtTA; tetO_NICD, n=1 female, n=5 males) mice were fed doxycycline for 3 weeks starting at 8 weeks of age with no washout period. Controls were αMHC-rtTA; tetO_NICD mice never fed doxycycline chow (n=2 females, n=4 males). RA and LV gene expression were measured from the same cohort of mice. (F) RT-qPCR from RA where Notch was induced for 2 days followed by a prolonged 1-year washout period reveals persistent Tbx5, Scn5a, and Gja5 transcript down-regulation. iNICD are αMHC-rtTA; tetO_NICD (n=2 females, n=3 males) and controls are αMHC-rtTA; tetO_NICD mice that were never administered doxycycline (n=2 females, n=3 males). Relative fold changes were in comparison with α-actinin. Statistics were performed using unpaired t tests with Welch’s correction. Values of P<0.05 were considered statistically significant.
