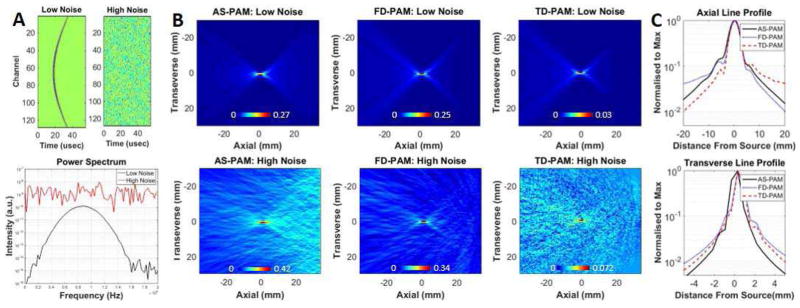
Fig. 2.
Insilico 2D passive acoustic mapping. A) Above: Simulated RF-data with different levels of white Gaussian noise added (left low noise, right high noise). Below: Power spectra generated from RF-data of the middle element of the virtual array for the low and high noise level cases. B) AS-PAM (left), FD-PAM (middle) and TD-PAM (right) with low (top) and high (bottom) white Gaussian noise. For AS-PAM and FD-PAM, 50 single-frequency maps at 0.25–1.5 MHz were superimposed. C) Axial and transverse line profiles from the maps with the low noise for the three back-propagation methods. The reconstruction time for a field of view of 70×80 mm with 0.54×0.54 mm pixels was 0.5±0.01 s with AS-PAM; 5.9±0.5 s with FD-PAM and 38.8±0.9 s with TD-PAM (pixel size: 0.54 mm2) it was 58 s. The 2D maps are rotated by 90 degrees with respect to the 3D maps in Fig. 1. The images were set to zero by means of minimum signal subtraction. All color maps are linear and expressed in a.u..

