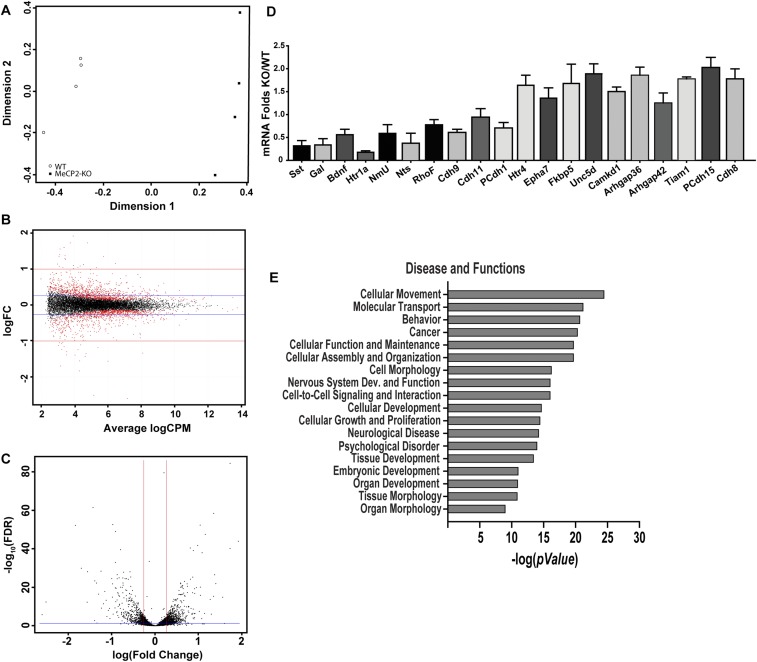
Fig. S5.
Validation and analyses of RNA Sequencing data. (A) Principal component analysis with counts obtained from STAR mapped reads and counted with HTSeq analysis done using the EdgeR program. DRG RNA was sequenced for four animals of each genotype. (B) Smear plot of expression in counts per million (cpm) vs. fold-change shows an unskewed and uniform distribution along the x axis, reflecting good quality of analysis. (C) Volcano plot of logarithm of fold-change vs. FDR P value of differentially expressed genes. Genes that are distributed above the blue line for FDR cut-off and beyond the red lines represent either up- or down-regulated (absolute fold-change cut-off = ±1.2) that were used in downstream analyses. Differential gene expression analysis with a P ≤ 0.05 for FDR revealed 720 up-regulated and 627 down-regulated genes at a cut-off of ±20% (1.2-fold). (D) qPCR validations of multiple significant MeCP2-regulated candidate genes revealed by the RNA-Seq. Values are fold-change in Mecp2−/y DRG mRNA relative to Mecp2x/y mRNA (n = 4 animals per group). (E) Disease and functions pathways significantly altered by MeCP2 KO in sensory neurons, as revealed in IPA of all regulated candidate genes with ±1.2 fold-change and FDR = 0.05 cut-off.

