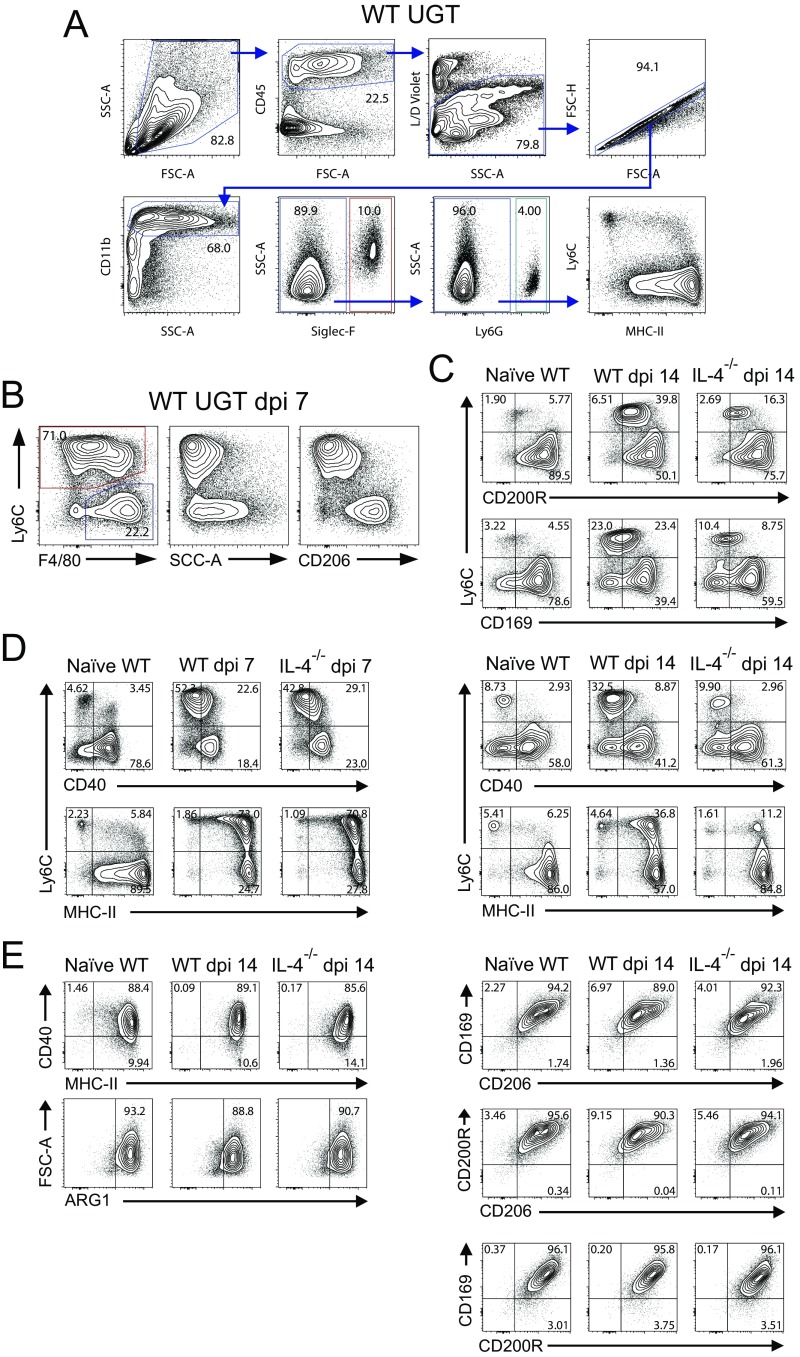
Fig. S2.
Gating strategies used to characterize polarization status of uterine myeloid cell populations. Groups of mice described in Figs. 4 and 5 were euthanized, and UGT was processed for flow cytometric evaluation of uterine myeloid cells as detailed in Materials and Methods. (A) Representative contour plots show gating strategy that defined live CD45+CD11b+Siglec-F+ cells (i.e., eosinophils). Myeloid cells not defined as eosinophils were assessed for Ly6G expression to identify PMNs. (B) Myeloid cells that were not eosinophils or PMNs were evaluated for Ly6C and F4/80 expression. This procedure identified two uterine myeloid populations, iMos (red gate) and Mϕs (blue gate), with distinct patterns of granularity and CD206 expression (plots shown are from a WT mouse at 7 dpi). (C) Uterine myeloid populations also displayed differential expression of other M2 markers, such as CD200R and CD169 (plots shown are from a WT and IL-4−/− mice before infection and at 14 dpi). (D) There were differences in expression of CD40, but not of MHC-II, between iMos and Mϕs in infected mice of both strains (plots shown are from a WT and IL-4−/− mice before infection, at dpi 7, and at dpi 14). (E) Uterine Mϕs expressing high CD206 levels concomitantly expressed high levels of CD40, MHC-II, and the M2 polarization markers arginase 1 (ARG1), CD169, CD200R, and CD206. This expression pattern was unchanged after C. trachomatis infection and was unaffected by disrupted IL-4 signaling (plots shown are from indicated strains of mice before infection and at 14 dpi); (results are representative of two independent experiments).

