Fig. 1.
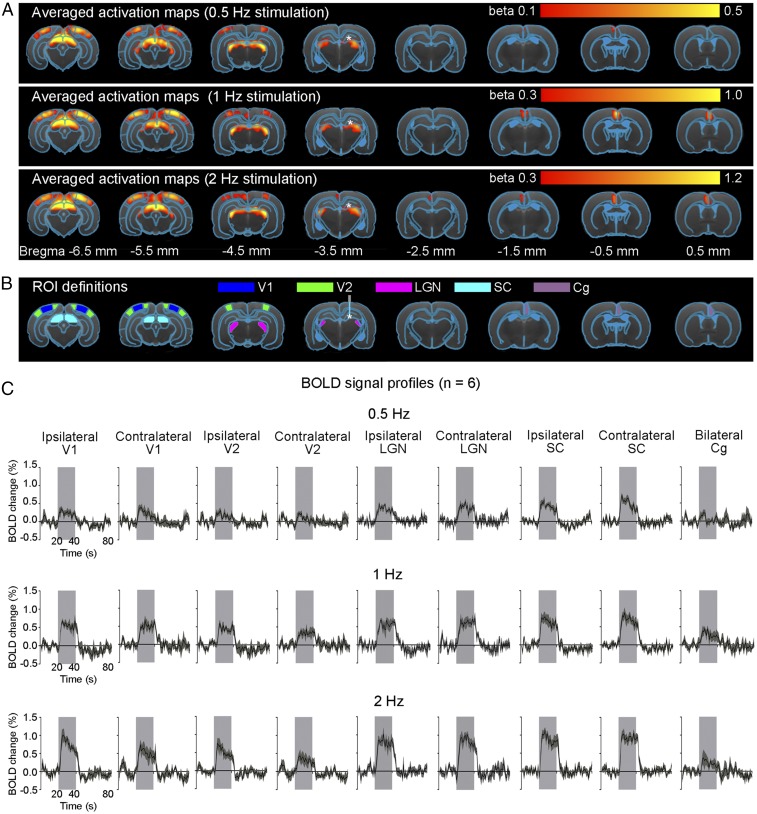
Brain-wide activation of visually related regions during low-frequency optogenetic stimulation of dDG excitatory neurons in dHP. (A) Averaged activation maps at 0.5-Hz (Top), 1-Hz (Middle), and 2-Hz (Bottom) stimulation. * indicates the stimulation site. Robust positive BOLD responses detected in bilateral V1, V2, LGN, and SC, as well as Cg (n = 6; t > 3.1, corresponding to P < 0.001). We used a lower statistical threshold (t > 2.5, corresponding to P < 0.01) for 0.5-Hz stimulation to detect the low BOLD responses. (B) Regions of interest (ROIs) defined by the rat brain atlas to extract the BOLD signal profiles. Abbreviations: g, cingulate cortex; LGN, lateral geniculate nucleus; SC, superior colliculus; V1, primary visual cortex; V2, secondary visual cortex. (C) The respective BOLD signal profiles extracted from the ROIs. Error bars indicate ±SEM.

