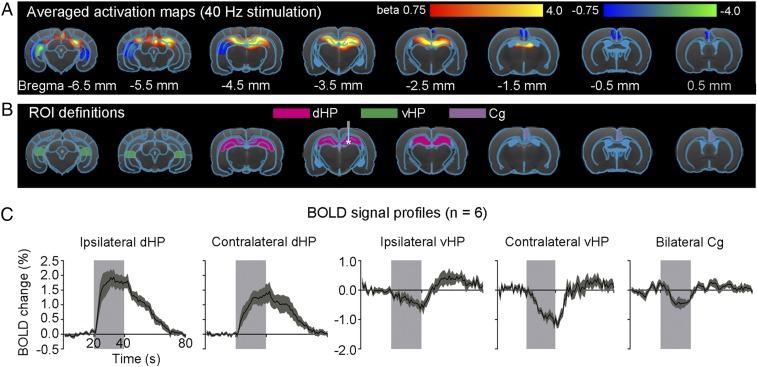
Fig. 2.
Local hippocampal activation and deactivation during 40-Hz optogenetic stimulation of dDG excitatory neurons in dHP. (A) Averaged activation maps at 40-Hz stimulation. * indicates the stimulation site. Robust positive BOLD responses are detected in bilateral dHP, whereas negative responses are detected in the bilateral vHP and Cg (n = 6; t > 3.1 or t < −3.1, corresponding to P < 0.001). (B) Regions of interest (ROIs) are based on the rat brain atlas to extract bold signal profiles. Abbreviations: Cg, cingulate cortex; dHP, dorsal hippocampus; vHP, ventral hippocampus. (C) BOLD signal profiles extracted from the ROIs. Error bars indicate ±SEM.

