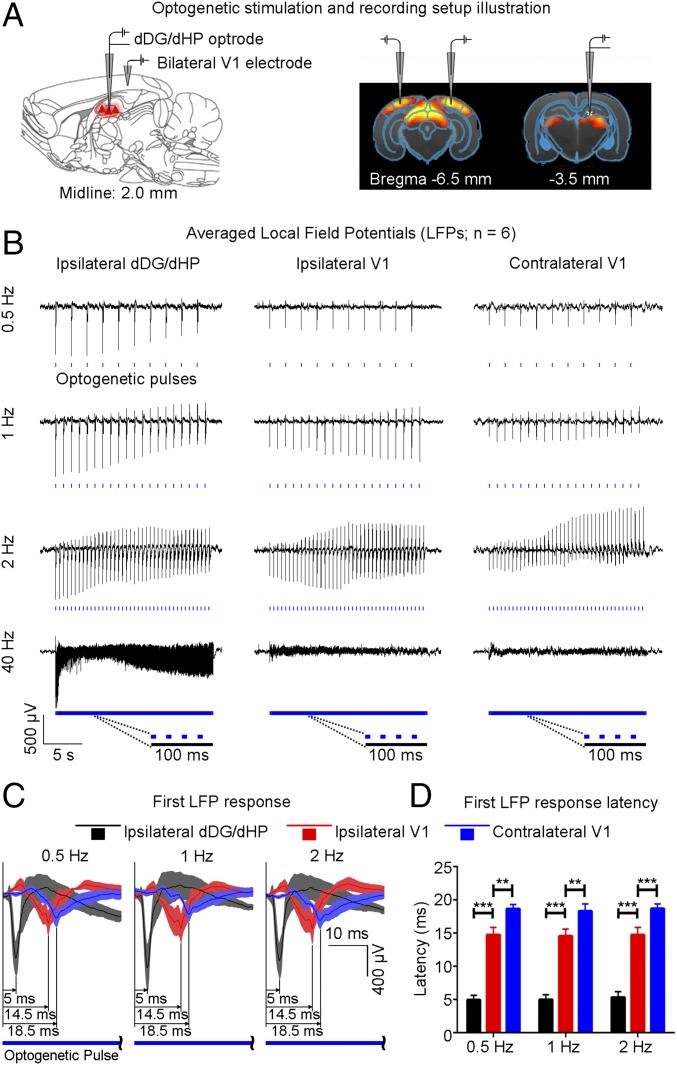
Fig. 3.
Local field potentials (LFPs) in ipsilateral dDG/dHP and bilateral V1 confirm neuronal activity underlies BOLD fMRI responses, and latency measurements indicate polysynaptic propagation of low-frequency activity from dHP. (A) Recording electrodes location in ipsilateral dDG/dHP and bilateral V1. (B) Averaged LFP traces in ipsilateral dDG/dHP and bilateral V1 for 0.5-Hz, 1-Hz, 2-Hz, and 40-Hz stimulation (n = 6). All frequencies evoked responses in ipsilateral dDG/dHP. Only low-frequency stimulation evoked strong responses in bilateral V1. (C) LFP responses from the first optogenetic pulse for 0.5-Hz, 1-Hz, and 2-Hz stimulation. Error bars indicate ±SEM. (D) Latency measurements of the first LFP response during low-frequency stimulation (0.5 Hz: ipsilateral dDG/dHP = 4.95 ± 0.71 ms, ipsilateral V1 = 14.77 ± 1.08 ms, contralateral V1 = 18.68 ± 0.65 ms; 1 Hz: ipsilateral dDG/dHP = 5.02 ± 0.71 ms, ipsilateral V1 = 14.57 ± 1.03 ms, contralateral V1 = 18.33 ± 1.06 ms; 2 Hz: ipsilateral dDG/dHP = 5.35 ± 0.85 ms, ipsilateral V1 = 14.77 ± 1.09 ms, contralateral V1 = 18.72 ± 0.68 ms; one-way ANOVA followed by Bonferroni’s post hoc test; **P < 0.01 and ***P < 0.001). Error bars indicate ±SEM.

