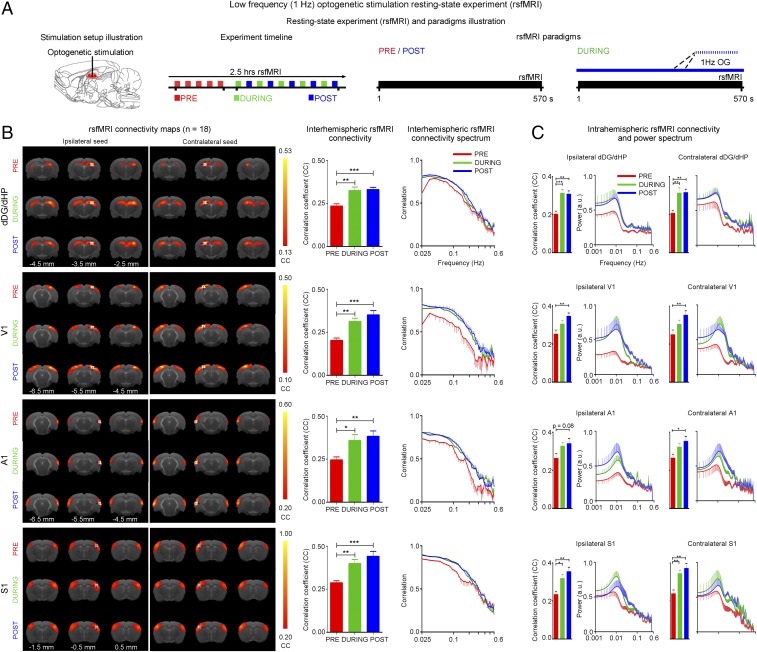
Fig. 4.
Increased interhemispheric rsfMRI connectivity during (during) and after (post) low-frequency (1 Hz) optogenetic stimulation of dDG excitatory neurons in dHP. (A) Schematic of the optogenetic stimulation setup (Left), a typical rsfMRI experiment timeline with five baseline (pre) scans acquired before five “during” scans interleaved with five post scans (Middle), and the corresponding rsfMRI paradigms used (Right). (B) RsfMRI connectivity maps of dHP, V1, A1, and S1 (Left), corresponding quantification of interhemispheric connectivity (Middle), and their respective connectivity spectrum (Right), pre, during, and post low-frequency optogenetic stimulation. rsfMRI maps generated by correlation analysis of band-pass filtered (0.005–0.1 Hz) BOLD signals using a seed defined in the ipsilateral and contralateral side. Seed location is indicated by a blue crosshair. Quantification of the interhemispheric rsfMRI connectivity (n = 18; one-way ANOVA followed by Bonferroni’s post hoc test; *P < 0.05, **P < 0.01, and ***P < 0.001; error bars indicate ±SEM). (C) Quantification of intrahemispheric rsfMRI connectivity (Left) and the respective power spectrum (Right) of ipsilateral and contralateral dHP, V1, A1, and S1.

