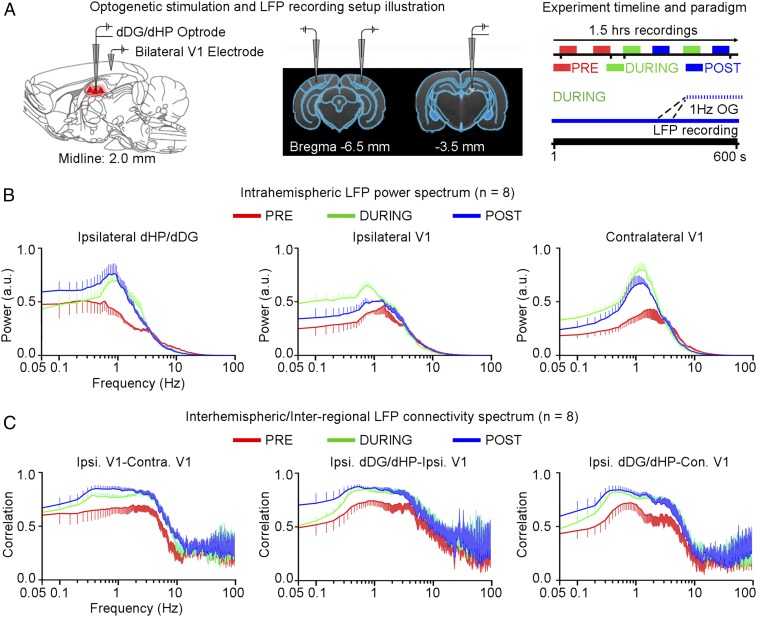
Fig. 5.
Increased slow (0.1–1 Hz) and delta (1–4 Hz) neuronal oscillations during (during) and after (post) low-frequency (1 Hz) optogenetic stimulation of dDG excitatory neurons in dHP. (A) Illustration of LFP recording electrode location in ipsilateral dDG/dHP and bilateral V1 (Left) and a typical LFP recording experiment timeline with the corresponding paradigms (Right). (B) Intrahemispheric LFP power spectrum of ipsilateral dDG/dHP and bilateral V1. Error bars indicate ±SEM. (C) LFP connectivity spectra for interhemispheric V1–V1 and interregional dDG/dHP–V1. Error bars indicate ±SEM.

