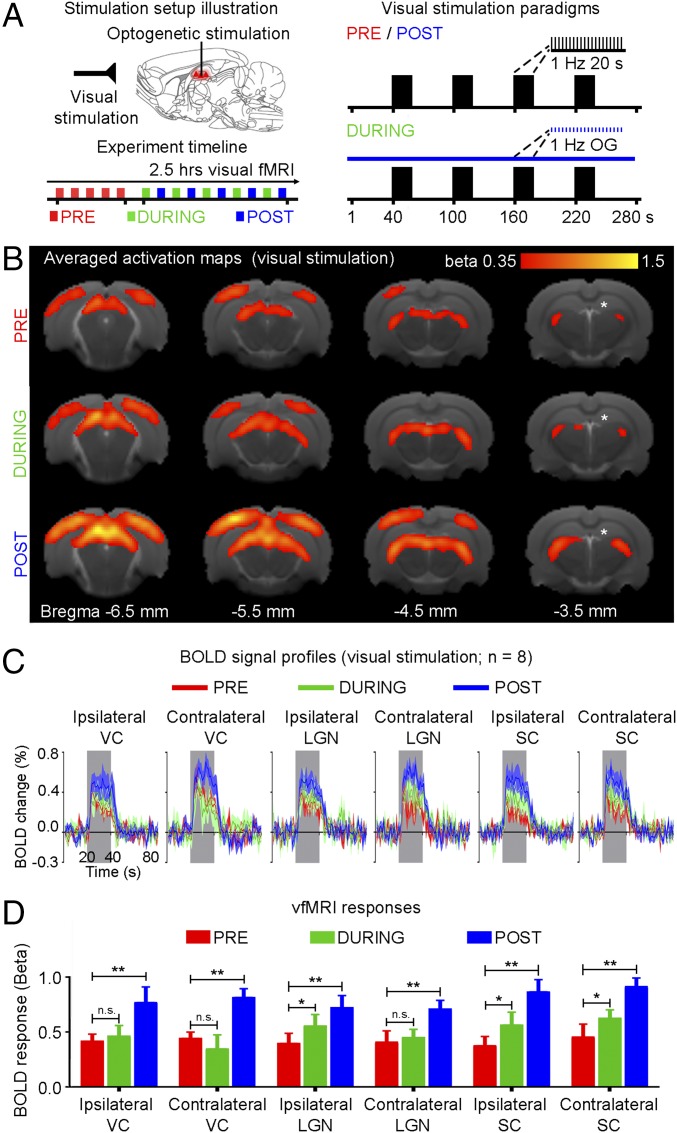
Fig. 8.
Low-frequency (1 Hz) optogenetic stimulation of dDG excitatory neurons in dHP enhances visually evoked fMRI responses. (A) Illustration of binocular visual and optogenetic fMRI stimulation setup (Top Left). Block design visual stimulation paradigm (20 s on, 60 s off) presented before (pre), during (during), and after (post) continuous low-frequency optogenetic stimulation (Right). Typically, five baseline visual fMRI scans were acquired before five “during” scans were interleaved with five post scans (Bottom Left). (B) Averaged activation maps for visual stimulation pre, during, and post low-frequency stimulation. BOLD responses are detected in bilateral V1, V2, LGN, and SC (n = 8; t > 3.1, corresponding to P < 0.001). (C) BOLD signal profiles in the bilateral V1, LGN, and SC. Error bars indicate ±SEM. (D) Comparison of vfMRI responses (one-way ANOVA followed by Bonferroni’s post hoc test; *P < 0.05 and **P < 0.01; error bars indicate ±SEM).

