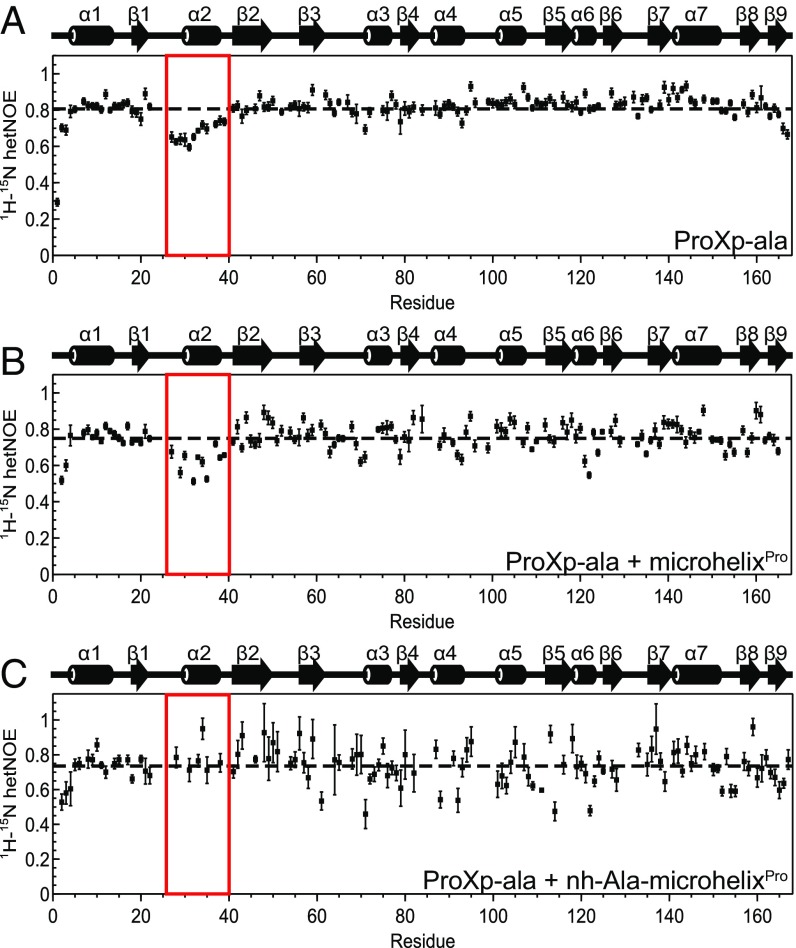
Fig. 4.
Amide 15N-relaxation values indicate ps-ns dynamics in α2 of Cc ProXp-ala, which are attenuated on substrate recognition. (A) 1H-15N heteronuclear NOE data for 0.5 mM free ProXp-ala. (B) 0.5 mM ProXp-ala bound to a molar equivalent of microhelixPro. (C) 0.2 mM ProXp-ala bound to a molar equivalent nh-Ala-microhelixPro. The red box in each indicates stretch of residues near helix α2 with values lower than the average (dashed line) in free ProXp-ala. Secondary structure elements of ProXp-ala are displayed above the plots.

