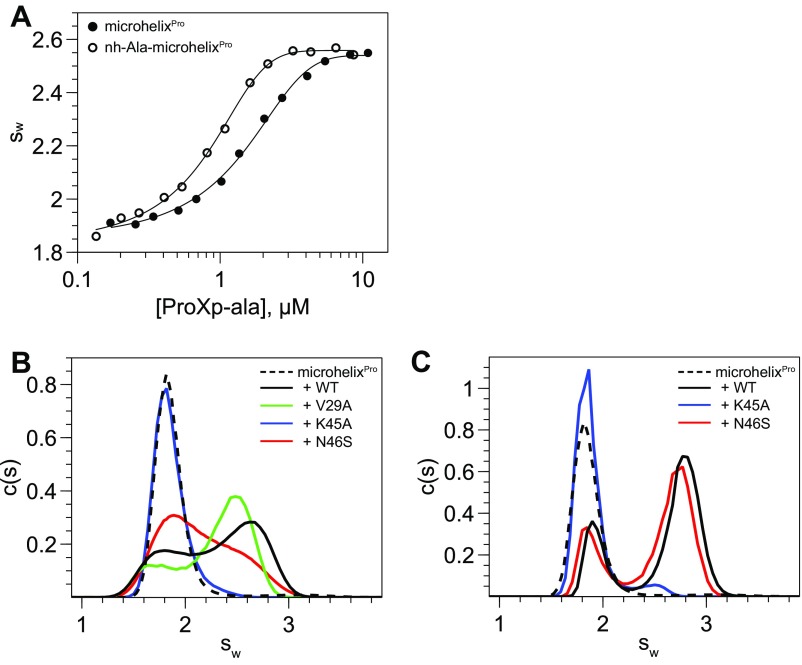
Fig. S1.
AUC data used for binding analyses in this study. (A) Isotherms of weight-average sedimentation coefficient as a function of ProXp-ala concentration. Analysis of the isotherm gives initial estimates of Kd values, which were refined by global data modeling using SEDPHAT. (B and C) Representative AUC sedimentation velocity data used to determine relative binding affinity of 1 μM microhelixPro to 1.2 μM (B) or 9.6 μM (C) WT or mutant ProXp-ala. Data are shown for microhelixPro alone (dashed line) and in the presence of WT (black), V29A (green), N46S (red), or K45A (blue) ProXp-ala. The c(s) distributions were integrated to find signal-weighted average sedimentation coefficients (sw). The sw values for each mutant were compared with that of 1.2 μM WT ProXp-ala (concentration at which ≈50% of microhelixPro is bound). The relative binding for each mutant was defined as follows: +++, equal or larger sw values for the 2.4 μM mutant, indicating a less than twofold reduction in affinity (as for V29A in B); ++, sw values smaller for the 2.4 μM mutant but larger for the 9.6 μM mutant, indicating a twofold to eightfold reduction in affinity (as for the N46S mutant in C); +, sw values smaller for the 9.6 μM mutant, indicating a greater than eightfold reduction in affinity; −, no binary complex observed up to the 9.6 μM mutant (as for K45A in C).

