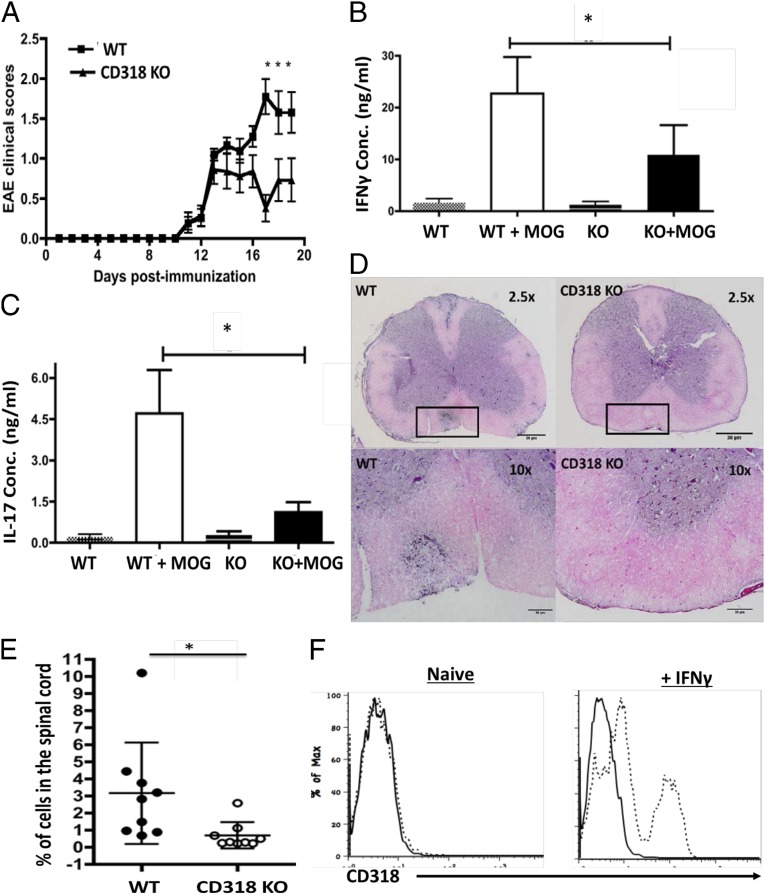
Fig. 5.
CD318 KO mice are protected in EAE. (A) WT and CD318 KO mice were immunized with MOG35–55 to induce EAE, and the development of EAE was monitored daily by clinical scoring. Combined results were from five individual experiments. WT, n = 21; CD318 KO, n = 25; data are mean ± SEM, *P < 0.05, (B and C). At the end of the experiments, splenocytes were collected and incubated with or without 10 μg/mL MOG35–55 peptide for 72 h. Levels of IFN-γ (B) and IL-17 (C) in the culture supernatants were measured by respective ELISA. Combined results were from three individual experiments, WT, n = 17; CD318 KO, n = 16; data are mean ± SEM, *P < 0.05. (D) Representative histology images of spinal cord sections from WT (Left) and CD318 KO (Right) mice in EAE, showing significantly reduced inflammation in the CD318 KO mouse spinal cords. Spinal cords were collected at the end of the experiment and processed for H&E staining. Squares in Upper show the areas that were amplified in Lower. (E) Flow cytometric analysis of infiltrated CD4+ T cells in spinal cord from WT and CD318 KO mice in EAE, showing significantly reduced CD4+ T-cell infiltration in the spinal cords of the CD318 KO mice in EAE. Spinal cords were collected at the end of the experiment, minced, and digested with collagenase. Single-cell suspension was prepared after Percoll centrifugation, stained with an anti-mouse CD4 mAb, and analyzed by a flow cytometer. (F) Mouse BMECs do not constitutively express CD318 but do after IFN-γ stimulation. Primary BMECs were isolated from WT mice, characterized, incubated without (Left) or with (Right) IFN-γ for 48 h, and stained with sheep anti-mouse CD318 IgG (dotted line) or control IgG (solid line), then analyzed on a flow cytometer.

