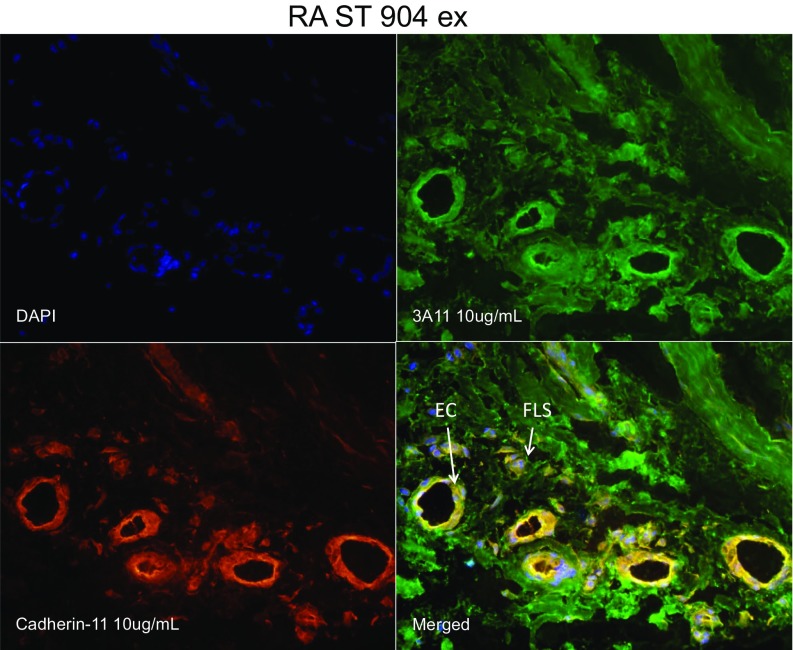
Fig. S2.
Immunofluorescence microscopy of synovial tissue. To further define the cellular CD318 expression in RA and OA synovium, synovial tissue (ST) slides were fixed with cold acetone for 20 min and blocked with 20% FBS and 5% goat serum for 1 h at 37 °C. Rabbit anti-human cadherin-11 antibody (GeneTex) and mouse anti-human CD318 antibody (3A11 antibody made in house) were used at 10 µg/mL for 1-h incubation at 37 °C. Nonspecific rabbit (Invitrogen) and mouse IgG (BD Biosciences) were used as respective antibody controls. STs were then washed and incubated for an additional hour with 10 µg/mL fluorescently conjugated goat anti-mouse/rabbit secondary antibodies [Alexa Fluor 555 (PE) for cadherin-11 binding; and 488 (FITC) for CD318 binding (Invitrogen)]. For nuclear staining, DAPI was used at 1:5,000 diluted in PBS. Images were taken at 400× magnification. Anti-CD318 positive synoviocytes are shown by fluorescent green staining, and cadherin-11 staining is shown by fluorescent red. Yellow cells are a result of a merger of the green and red fields showing dual fluorescence of cadherin-11 and CD318 expression on the same cells within the ST.

