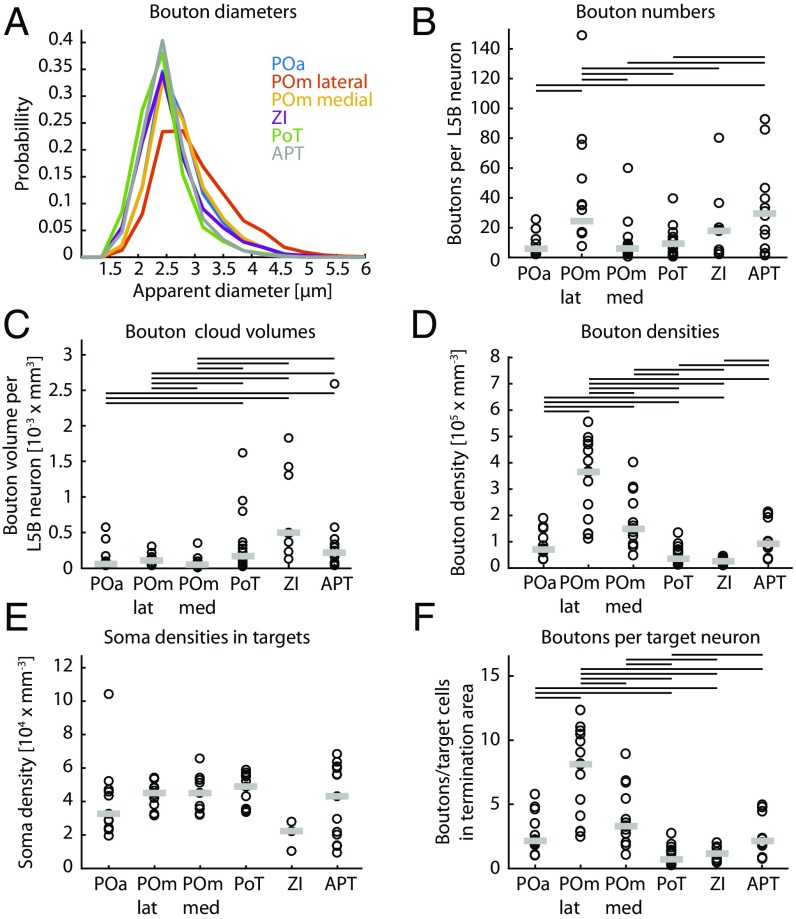
Fig. 4.
Quantification of projection parameters. Parameter estimates of L5B subcortical projections for each target nucleus. (A) Probability histogram of bouton diameters (only GFP-labeled) in the different nuclei as indicated by different colors. (B–F) The value for each experiment (both GFP and mOrange) is represented by black circles, and the median of all experiments is represented by gray lines. Black lines at the top of the panel indicate which nuclei are significantly different from each other (Wilcoxon signed rank test, P < 0.05). (B) The number of boutons in different nuclei, normalized by the number of labeled L5B neurons (median = 91 L5B neurons; Q1: 50, Q3: 141). (C) Bouton cloud volumes in different nuclei normalized by the number of labeled L5B neurons (median = 91 L5B neurons; Q1: 50, Q3: 141). (D) Bouton cloud densities (the ratio of bouton number to cloud volume). (E) Soma densities from NeuroTrace staining measured in a subsample of sections in two experiments. (F) The number of boutons per target cell (ratio of bouton densities to neuron densities).

