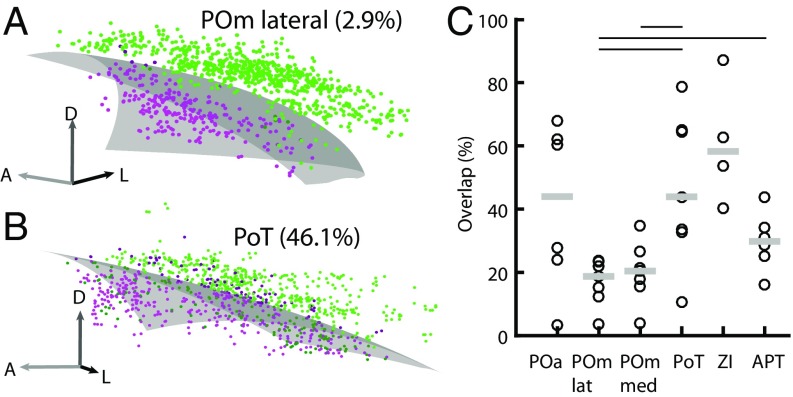
Fig. 5.
Overlap between GFP- and mOrange-labeled bouton clouds calculated with GLMs. (A) A low-overlap example from the POmlateral showing a randomly selected subset of 1,000 boutons for clarity. The transparent gray surface illustrates the GLM-modeled surface that gives the best separation of bouton clouds (green and magenta dots). Overlap boutons are plotted in a dark shade of green and magenta, respectively. The percentage of boutons in the overlap volume is proportional to cloud overlap. (B) As in A but showing a high-overlap example from the PoT. (C) Estimated overlaps for all target nuclei. Each circle represents one experiment; gray bars show the median. Lines above the panel indicate which target nuclei are significantly different from each other (Wilcoxon signed rank test, P < 0.05).

