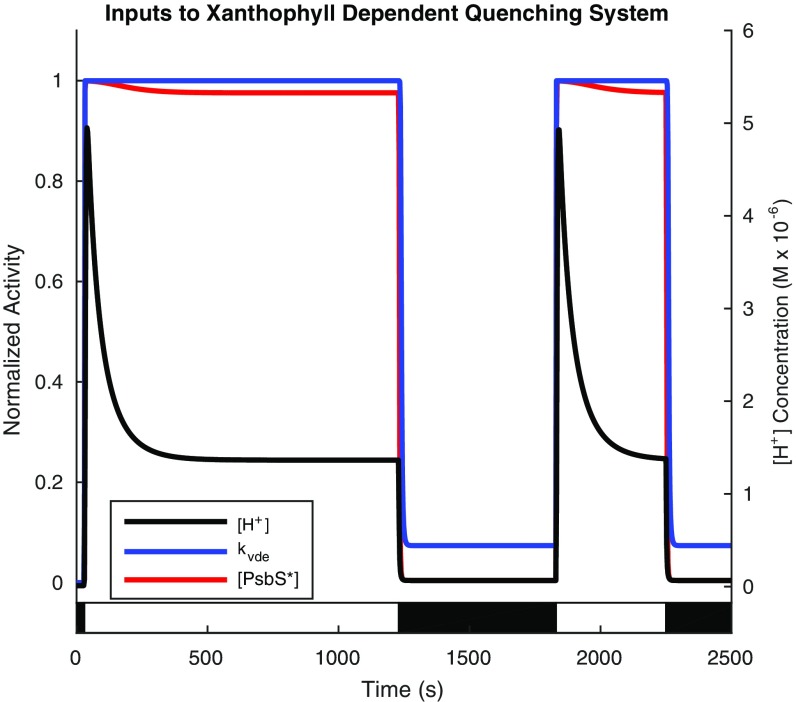
Fig. S3.
Dynamics of thylakoid membrane ∆pH in terms of [H+] concentration gradient and activation of PsbS and VDE. The black line shows the [H+] concentration for the light acclimation scheme shown in the light and dark bars superimposed on the plot. It displays a rapid spike on high light exposure followed by a decay to a steady-state value; on dark acclimation, [H+] concentration rapidly recovers to a dark-adapted quasisteady-state value. The blue line shows the normalized activity of VDE, which is activated on the formation of the ∆pH. The red line shows the normalized activation of PsbS on the formation of the ∆pH. All values were obtained from the model provided in the work by Zaks et al. (37).

